


Hr Kpi Dashboard To Track Employee Succession Planning To Identify Talent And Critical Job Roles




Try Before you Buy Download Free Sample Product
 Impress Your
 Audience
 100%
100% Editable
 Save Hours
 of Time


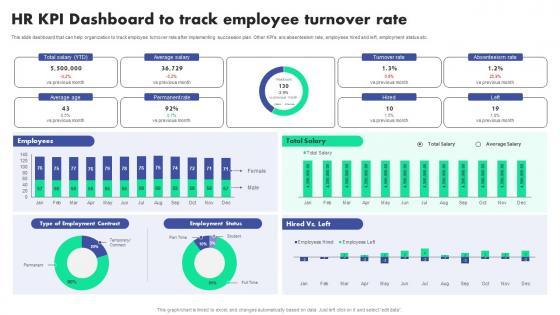
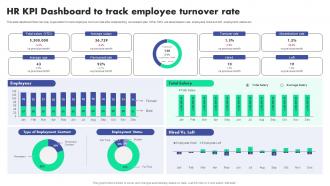
This slide dashboard that can help organization to track employee turnover rate after implementing succession plan. Other KPIs are absenteeism rate, employees hired and left, employment status etc.
People who downloaded this PowerPoint presentation also viewed the following :
Hr Kpi Dashboard To Track Employee Succession Planning To Identify Talent And Critical Job Roles with all 10 slides:
Use our Hr Kpi Dashboard To Track Employee Succession Planning To Identify Talent And Critical Job Roles to effectively help you save your valuable time. They are readymade to fit into any presentation structure.








FAQs for Hr Kpi Dashboard To Track Employee Succession Planning To Identify Talent And
HR KPI dashboards typically include employee turnover rates, time-to-hire, employee satisfaction scores, absenteeism rates, training completion rates, and performance review metrics. These indicators enable organizations to streamline talent management, enhance workforce planning, and improve retention strategies, with many companies finding that comprehensive dashboards ultimately deliver better employee experiences and operational efficiency.
An HR KPI dashboard improves talent acquisition by tracking time-to-hire, cost-per-hire, source effectiveness, candidate quality scores, and offer acceptance rates. These metrics enable HR teams to identify the most productive recruitment channels, streamline hiring processes, and optimize resource allocation, with many organizations finding significantly faster placements and reduced recruitment costs.
Effective HR KPI dashboard design involves selecting relevant metrics, ensuring visual clarity, enabling real-time data access, creating intuitive navigation, and aligning with strategic objectives. These dashboards streamline workforce analytics by presenting turnover rates, performance metrics, and recruitment efficiency through interactive visualizations, with many organizations finding that well-designed interfaces ultimately enhance decision-making speed and strategic workforce planning.
HR KPIs should be reviewed monthly for strategic metrics like turnover and engagement, while operational indicators such as time-to-hire and attendance require weekly or real-time updates. This balanced approach enables HR teams to respond quickly to emerging trends, address workforce challenges proactively, and maintain accurate data for decision-making, ultimately delivering better employee experiences and organizational performance.
Data visualization transforms HR KPI dashboards by converting complex workforce metrics into intuitive charts, graphs, heat maps, and trend lines that enable instant comprehension. Through visual elements like color-coded performance indicators and interactive filters, HR professionals can quickly identify talent gaps, track employee engagement patterns, and monitor retention trends, ultimately streamlining decision-making and enhancing strategic workforce planning across organizations.
Organizations measure employee engagement through HR KPI dashboards by tracking metrics like employee satisfaction scores, retention rates, absenteeism levels, participation in company initiatives, and internal mobility rates. These dashboards enable HR teams to identify engagement trends, benchmark performance across departments, and implement targeted interventions, ultimately delivering improved workplace culture and enhanced organizational productivity.
**INPUT**: What tools and software are commonly used to create HR KPI dashboards? **OUTPUT**: HR KPI dashboard tools include Microsoft Power BI, Tableau, Google Data Studio, HR-specific platforms like BambooHR and Workday, and Excel for basic implementations. These technologies streamline workforce analytics by automating data collection, visualizing trends, and enabling real-time reporting, with many organizations finding that integrated dashboards significantly enhance strategic decision-making and operational efficiency. **Word count: 54 words**
HR KPI dashboards identify skills gaps by tracking competency assessments, performance metrics, training completion rates, and role-specific skill inventories across departments. Through real-time analytics, organizations can pinpoint underperforming areas, compare current capabilities against future needs, and prioritize strategic training investments, ultimately enabling targeted workforce development that enhances operational efficiency and competitive positioning.
Common implementation challenges include data integration complexities, resistance to change from HR teams, selecting relevant metrics, ensuring data accuracy, and securing executive buy-in. These obstacles often stem from fragmented HR systems, lack of technical expertise, and unclear strategic alignment, with many organizations finding that comprehensive training and phased rollouts significantly enhance adoption rates and dashboard effectiveness.
Predictive analytics transforms HR KPI dashboards by forecasting employee turnover, identifying performance trends, predicting recruitment needs, and analyzing engagement patterns before issues arise. Through machine learning algorithms, organizations can anticipate talent gaps, optimize workforce planning, and implement proactive retention strategies, ultimately delivering strategic competitive advantage and significantly reducing costly reactive HR decisions.
Employee retention metrics should prioritize turnover rate by department and tenure, voluntary vs. involuntary departures, exit interview insights, employee satisfaction scores, and promotion rates. These indicators enable HR teams to identify retention patterns across different business units, particularly in high-turnover sectors like retail and hospitality, ultimately delivering targeted retention strategies and improved workforce stability.
HR KPI dashboards can be customized through configurable metrics, role-based access controls, industry-specific templates, automated reporting frequencies, and personalized visualization formats. These dashboards enable organizations across manufacturing, healthcare, and financial services to track recruitment efficiency, employee satisfaction, and retention rates, ultimately delivering strategic workforce insights and competitive talent management advantages.
HR KPI dashboards support compliance by centralizing workforce data, tracking regulatory metrics, automating report generation, monitoring equal opportunity indicators, and maintaining audit trails for documentation purposes. These systems enable organizations to proactively identify compliance gaps, streamline regulatory submissions, and demonstrate adherence to labor laws, with many companies finding that automated dashboards significantly reduce compliance risks while enhancing reporting accuracy.
HR KPIs vary significantly across industries, with healthcare focusing on compliance and retention, financial services emphasizing regulatory training and risk management, manufacturing prioritizing safety metrics and workforce productivity, and retail concentrating on seasonal staffing and customer service training. Effective dashboards accommodate these differences by offering customizable templates and industry-specific benchmarks, enabling organizations to track relevant metrics while maintaining strategic alignment with sector-specific challenges and operational priorities.
Comparing historical HR KPIs through dashboards reveals critical workforce trends including turnover patterns, recruitment efficiency changes, performance trajectory shifts, and compensation effectiveness over time. These insights enable HR leaders to identify seasonal hiring needs, predict retention risks, and optimize talent strategies, with many organizations finding that historical comparisons significantly enhance strategic workforce planning and competitive advantage.
-
Really like the color and design of the presentation.
-
Unique design & color.