HR KPI Dashboard To Track Employee Turnover Rate Talent Management And Succession

Rating:
80%
HR KPI Dashboard To Track Employee Turnover Rate Talent Management And Succession
Slide 1 of 10
Favourites Favourites

Try Before you Buy Download Free Sample Product

Audience Impress Your
Audience
Editable 100%
Editable
Time Save Hours
of Time
The Biggest Sale is ending soon in
0
0
:
0
0
:
0
0
Rating:
80%
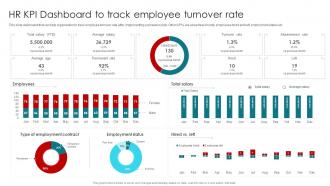
This slide dashboard that can help organization to track employee turnover rate after implementing succession plan. Other KPIs are absenteeism rate, employees hired and left, employment status etc. Deliver an outstanding presentation on the topic using this HR KPI Dashboard To Track Employee Turnover Rate Talent Management And Succession. Dispense information and present a thorough explanation of Employment Contract, Dashboard, Employee Turnover Rate using the slides given. This template can be altered and personalized to fit your needs. It is also available for immediate download. So grab it now.

FAQs for HR KPI Dashboard To Track Employee Turnover Rate Talent

So for HR metrics, I'd definitely track turnover rates by department first - that's honestly where you'll spot the biggest red flags with bad managers. Time-to-fill and cost-per-hire are solid basics too. Employee engagement scores matter, but turnover tells the real story about your culture. Oh, and retention rates for your top performers - losing those people is expensive as hell. Training completion rates, diversity numbers, and how many people are moving up internally will show if you're actually developing talent or just spinning wheels. Performance review completion is boring but leadership always asks about it. Start there and see what your exec team actually cares about.

Honestly, data viz is a game changer for HR stuff. You'll actually see what's happening instead of staring at endless spreadsheet rows (which is torture, let's be real). Turnover patterns jump out immediately. Same with recruiting bottlenecks or satisfaction dips. Dashboards show you which teams are struggling and help track your goals without the headache. When you're presenting to executives, visuals just hit different than a bunch of numbers. Way more convincing. My advice? Pick your top 3-5 metrics first and start there. Don't try to visualize everything at once or you'll go crazy.

Honestly, engagement scores should be right at the top of your HR dashboard - they're like the canary in the coal mine for everything else. Low engagement hits way before you see turnover or performance issues, so it gives you time to actually fix things. Most dashboards I've seen totally miss this connection though. Figure out what drives engagement at your company first, then track both those scores and what happens downstream. It's wild how much engagement predicts turnover and productivity. Makes building the rest of your KPI priorities way easier once you nail that part down.

Honestly, just figure out what actually moves the needle for your business first. High-growth startup? Time-to-hire and retention are your best friends. More cost-conscious? Track cost-per-hire and training ROI instead. Don't fall into the trap of measuring everything - I've seen so many dashboards that are just... overwhelming noise. Stick to maybe 5-7 metrics that leadership will actually use to make decisions. Also, your CEO doesn't need the same level of detail as your hiring managers, so customize what each person sees. Start basic and build from there based on what questions keep coming up in meetings.

Honestly, go with Tableau or Power BI first - there's a reason everyone uses them. They make HR data look actually impressive instead of like a boring spreadsheet. Power BI's probably your best bet if you're already using Microsoft stuff since it plays nice with everything. Google Data Studio works too if budget's tight, though it's kinda basic. I mean, you *could* build something decent in Excel with pivot tables, but that becomes a nightmare once your data gets big. Oh, and Power BI has pre-made HR templates which is pretty clutch. Trust me, executives love dashboards that don't put them to sleep.

Check your HR metrics monthly but only update the main dashboard every quarter. Most stuff like turnover and satisfaction scores don't change that fast anyway. Monthly reviews help you catch problems early though - way better than waiting until things get messy. Recruiting metrics are different - I'd look at those weekly during busy seasons because hiring managers will literally blow up your phone asking for updates. It's honestly kind of annoying but whatever. Just match how often you check each metric to how quickly it actually moves and whether leadership freaks out about it.

Honestly? Data quality is your biggest headache - stuff's everywhere and half of it's wrong. Leadership buy-in is tough too since they still see HR metrics as fluff. Start with maybe 3-5 metrics that actually matter to the business, like what turnover is costing you. Fix your messy data first (trust me on this one). Then slowly add more stuff. Oh, and definitely get your stakeholders to pick what they want to see. Otherwise you'll build this beautiful dashboard that nobody touches. Been there.

So instead of just seeing turnover hit 15% last quarter, you can actually predict which people might bail in the next 6 months. It uses engagement scores, performance data, all that stuff. Works for hiring forecasts too - honestly way more useful than just backward-looking reports. You can spot your future stars early or catch retention issues before someone actually quits. Quality data is everything though. Garbage in, garbage out, you know? I'd start with just one thing you really care about, like turnover risk. Don't try to predict everything at once or you'll go nuts.

Honestly, start with time-to-fill and cost-per-hire - those are your bread and butter metrics. Quality of hire is trickier but super important, so track performance ratings and 90-day retention for new hires. Source of hire data will save you tons of headaches by showing which recruiting channels actually work versus the ones that just waste your budget. Offer acceptance rates matter too, plus candidate satisfaction scores if you can swing it. Oh, and diversity metrics if your company cares about that stuff. Don't go crazy with fancy dashboards right away though - nail these basics first, then add hiring manager satisfaction later.

So basically, an HR dashboard acts like your early warning system for when people are about to bail. Track stuff like satisfaction scores, how long people stick around, and what they say in exit interviews. Honestly, the best part is drilling down by team or manager - you'll spot exactly where problems are bubbling up. Watch for weird patterns too: more sick days, dropping performance, people skipping company events. Set alerts when your retention numbers get sketchy so you can actually do something before half your engineering team walks out the door.

Yeah, definitely include D&I metrics in your dashboard. Honestly, it's become business-critical now - boards won't stop asking about this stuff. Track representation at different levels, pay gaps, retention by demographic, and inclusion survey results. The trick is connecting these numbers to bigger business outcomes like engagement and turnover rates. Pick maybe 3-4 key metrics that actually matter for your company's goals and track them monthly. Don't go overboard with too many at first though - you'll just overwhelm yourself trying to analyze everything.

Tell a story with your numbers instead of just throwing data at people. Clean visuals work best - bar charts, trend lines, stuff they can understand instantly. I always use red/yellow/green because honestly, executives love that traffic light system. Makes their life easier. Group similar metrics together so retention numbers aren't scattered everywhere. Context is huge too - show them how you're doing versus last quarter or industry standards. Oh, and put your biggest wins or problems right at the top. They'll dig deeper if they want to, but most just need the headlines first.

So you know how HR stuff can blow up out of nowhere? Dashboards totally save your butt by tracking everything - training rates, turnover by team, safety incidents, diversity numbers. When patterns pop up (like one manager losing tons of people), you'll catch potential harassment or management disasters early. Way less stressful than digging through random spreadsheets when compliance people show up! Honestly the automated alerts are clutch - they ping you before small problems turn into actual lawsuits. Plus auditors love seeing you've got your act together.

Oh man, the worst thing is cramming like 50 different metrics on one screen - total information overload. Most companies forget to think about who's actually gonna use this thing daily. They track vanity metrics that look cool but don't help anyone make real decisions. Plus half the time the data's outdated or you can't dig deeper when something looks off. Honestly, just pick 5-7 metrics that actually matter to your team and make sure people can act on what they're seeing. Way more effective than those monster dashboards nobody understands.

So basically, you want to connect your survey tools (Culture Amp, Google Forms, whatever) straight to your dashboard so feedback data flows in automatically. Pull in stuff like pulse survey results, exit interview notes, and engagement scores. Most dashboard platforms let you build widgets for sentiment trends and eNPS tracking. Pick 2-3 metrics your leadership actually cares about first—don't go crazy trying to track everything. The real pain point? Getting people to consistently take the damn surveys. That's honestly harder than the tech setup. Start simple and add more feedback sources once you've got a solid rhythm going.

Ratings and Reviews

80% of 100
Review Form
Write a review
Most Relevant Reviews
  1. 80%

    by Earnest Carpenter

    Great quality slides in rapid time.
  2. 80%

    by Dewayne Nichols

    Their professional templates are very impressive, even my manager was curious about the source. I am very grateful.

2 Item(s)

per page: