Powerpoint Templates for Financial Graphs
Save time and engage your audience with our fully editable PowerPoint PPT Templates and Slides.
-

Financial Graphs And Visual Analytics Pack PPT Summary AT
Step up your game with our enchanting Financial Graphs And Visual Analytics Pack PPT Summary AT deck, guaranteed to leave a lasting impression on your audience. Crafted with a perfect balance of simplicity, and innovation, our deck empowers you to alter it to your specific needs. You can also change the color theme of the slide to mold it to your companys specific needs. Save time with our ready made design, compatible with Microsoft versions and Google Slides. Additionally, its available for download in various formats including JPG, JPEG, and PNG. Outshine your competitors with our fully editable and customized deck.
-

Current And Quick Ratio Financial Graphs PPT Summary AT
While your presentation may contain top-notch content, if it lacks visual appeal, you are not fully engaging your audience. Introducing our Current And Quick Ratio Financial Graphs PPT Summary AT deck, designed to engage your audience. Our complete deck boasts a seamless blend of Creativity and versatility. You can effortlessly customize elements and color schemes to align with your brand identity. Save precious time with our pre-designed template, compatible with Microsoft versions and Google Slides. Plus, its downloadable in multiple formats like JPG, JPEG, and PNG. Elevate your presentations and outshine your competitors effortlessly with our visually stunning 100 percent editable deck.
-
Domestic And Export Sales Growth Financial Graphs PPT Demonstration AT
While your presentation may contain top notch content, if it lacks visual appeal, you are not fully engaging your audience. Introducing our Domestic And Export Sales Growth Financial Graphs PPT Demonstration AT deck, designed to engage your audience. Our complete deck boasts a seamless blend of Creativity and versatility. You can effortlessly customize elements and color schemes to align with your brand identity. Save precious time with our pre designed template, compatible with Microsoft versions and Google Slides. Plus, its downloadable in multiple formats like JPG, JPEG, and PNG. Elevate your presentations and outshine your competitors effortlessly with our visually stunning 100 percent editable deck.
-
Financial Graphs For Analysis And Insights PPT Presentation ACP
Ditch the Dull templates and opt for our engaging Financial Graphs For Analysis And Insights PPT Presentation ACP deck to attract your audience. Our visually striking design effortlessly combines creativity with functionality, ensuring your content shines through. Compatible with Microsoft versions and Google Slides, it offers seamless integration of presentation. Save time and effort with our pre-designed PPT layout, while still having the freedom to customize fonts, colors, and everything you ask for. With the ability to download in various formats like JPG, JPEG, and PNG, sharing your slides has never been easier. From boardroom meetings to client pitches, this deck can be the secret weapon to leaving a lasting impression.
-
Income Statement Financial Graphs With Income And Revenue PPT PowerPoint AT
Step up your game with our enchanting Income Statement Financial Graphs With Income And Revenue PPT PowerPoint AT deck, guaranteed to leave a lasting impression on your audience. Crafted with a perfect balance of simplicity, and innovation, our deck empowers you to alter it to your specific needs. You can also change the color theme of the slide to mold it to your companys specific needs. Save time with our ready-made design, compatible with Microsoft versions and Google Slides. Additionally, its available for download in various formats including JPG, JPEG, and PNG. Outshine your competitors with our fully editable and customized deck.
-
Visualizing Financial Growth With Line Graphs PPT Slides AT
Step up your game with our enchanting Visualizing Financial Growth With Line Graphs PPT Slides AT deck, guaranteed to leave a lasting impression on your audience. Crafted with a perfect balance of simplicity, and innovation, our deck empowers you to alter it to your specific needs. You can also change the color theme of the slide to mold it to your companys specific needs. Save time with our ready made design, compatible with Microsoft versions and Google Slides. Additionally, its available for download in various formats including JPG, JPEG, and PNG. Outshine your competitors with our fully editable and customized deck.
-
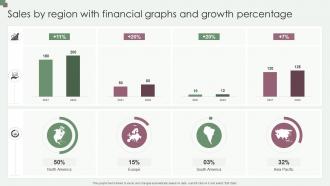
Sales By Region With Financial Graphs And Growth Percentage
Presenting our well-structured Sales By Region With Financial Graphs And Growth Percentage. The topics discussed in this slide are Sales By Region, Financial Graphs, Growth Percentage. This is an instantly available PowerPoint presentation that can be edited conveniently. Download it right away and captivate your audience.
-
1013 3d man with financial graphs ppt graphics icons powerpoint
We are proud to present our 1013 3d man with financial graphs ppt graphics icons powerpoint. Our 3D Man help you pinpoint your timelines. Highlight the reasons for your deadlines with their use.
-
Financial Growth Graphs For Revenue Analysis PPT Template AT
Do not compromise on a template that erodes your messages impact. Introducing our engaging Financial Growth Graphs For Revenue Analysis PPT Template AT complete deck, thoughtfully crafted to grab your audiences attention instantly. With this deck, effortlessly download and adjust elements, streamlining the customization process. Whether you are using Microsoft versions or Google Slides, it fits seamlessly into your workflow. Furthermore, it is accessible in JPG, JPEG, PNG, and PDF formats, facilitating easy sharing and editing. Not only that you also play with the color theme of your slides making it suitable as per your audiences preference.
-
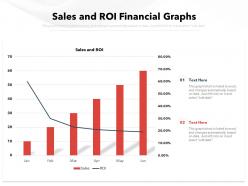
Sales and roi financial graphs
Presenting this set of slides with name Sales And ROI Financial Graphs. The topics discussed in these slide is Sales And ROI Financial Graphs. This is a completely editable PowerPoint presentation and is available for immediate download. Download now and impress your audience.
-
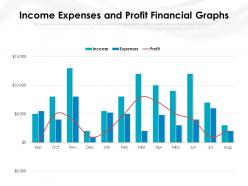
Income expenses and profit financial graphs
Presenting this set of slides with name Income Expenses And Profit Financial Graphs. The topics discussed in these slide is Income Expenses And Profit Financial Graphs. This is a completely editable PowerPoint presentation and is available for immediate download. Download now and impress your audience.
-
Income statement calculation with financial graphs
Presenting our well structured Income Statement Calculation With Financial Graphs. The topics discussed in this slide are Current Ratio, Cash Ratio, Quick Ratio. This is an instantly available PowerPoint presentation that can be edited conveniently. Download it right away and captivate your audience.
-
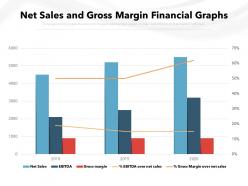
Net sales and gross margin financial graphs
Presenting this set of slides with name Net Sales And Gross Margin Financial Graphs. The topics discussed in these slide is Net Sales And Gross Margin Financial Graphs. This is a completely editable PowerPoint presentation and is available for immediate download. Download now and impress your audience.
-
Recruitment company profile with financial graphs
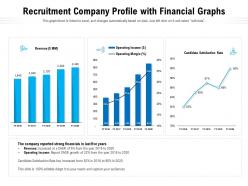
Presenting our well-structured Recruitment Company Profile With Financial Graphs. The topics discussed in this slide are Revenue, Candidate Satisfaction Rate, Operating Income. This is an instantly available PowerPoint presentation that can be edited conveniently. Download it right away and captivate your audience.
-
It solution company profile with financial graphs
Presenting our well-structured IT Solution Company Profile With Financial Graphs. The topics discussed in this slide are Revenue, Operating Income, Net Income, Information Technology, Financials. This is an instantly available PowerPoint presentation that can be edited conveniently. Download it right away and captivate your audience.
-
Gross profit margin financial graphs
Presenting this set of slides with name Gross Profit Margin Financial Graphs. The topics discussed in these slide is Gross Profit Margin Financial Graphs. This is a completely editable PowerPoint presentation and is available for immediate download. Download now and impress your audience.
-
Financial Summary And Graphs Included PPT Slides AT
Step up your game with our enchanting Financial Summary And Graphs Included PPT Slides AT deck, guaranteed to leave a lasting impression on your audience. Crafted with a perfect balance of simplicity, and innovation, our deck empowers you to alter it to your specific needs. You can also change the color theme of the slide to mold it to your companys specific needs. Save time with our ready made design, compatible with Microsoft versions and Google Slides. Additionally, its available for download in various formats including JPG, JPEG, and PNG. Outshine your competitors with our fully editable and customized deck.
-
Income statement financial graphs with income and revenue
Presenting this set of slides with name Income Statement Financial Graphs With Income And Revenue. The topics discussed in these slide is Income Statement Financial Graphs With Income And Revenue. This is a completely editable PowerPoint presentation and is available for immediate download. Download now and impress your audience.
-
Domestic and export sales growth financial graphs
Presenting this set of slides with name Domestic And Export Sales Growth Financial Graphs. The topics discussed in these slide is Domestic And Export Sales Growth Financial Graphs. This is a completely editable PowerPoint presentation and is available for immediate download. Download now and impress your audience.
-
Current and quick ratio financial graphs
Presenting this set of slides with name Current And Quick Ratio Financial Graphs. The topics discussed in these slide is Current And Quick Ratio Financial Graphs. This is a completely editable PowerPoint presentation and is available for immediate download. Download now and impress your audience.
-
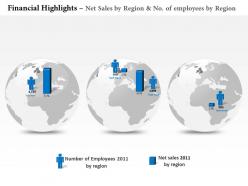
Financial highlight graphs with net sales and growth
Presenting this set of slides with name Financial Highlight Graphs With Net Sales And Growth. The topics discussed in these slide is Financial Highlight Graphs With Net Sales And Growth. This is a completely editable PowerPoint presentation and is available for immediate download. Download now and impress your audience.
-
Sales profit and gross margin financial highlights graphs
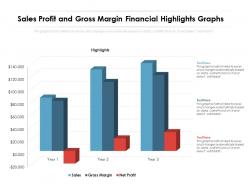
Presenting this set of slides with name Sales Profit And Gross Margin Financial Highlights Graphs. The topics discussed in these slide is Sales Profit And Gross Margin Financial Highlights Graphs. This is a completely editable PowerPoint presentation and is available for immediate download. Download now and impress your audience.
-
Professional 3D Bar Graphs For Financial Reports PPT Slides AT
Step up your game with our enchanting Professional 3D Bar Graphs For Financial Reports PPT Slides AT deck, guaranteed to leave a lasting impression on your audience. Crafted with a perfect balance of simplicity, and innovation, our deck empowers you to alter it to your specific needs. You can also change the color theme of the slide to mold it to your companys specific needs. Save time with our ready-made design, compatible with Microsoft versions and Google Slides. Additionally, its available for download in various formats including JPG, JPEG, and PNG. Outshine your competitors with our fully editable and customized deck.
-
Graphs For Financial Analysis PPT Structure AT
Step up your game with our enchanting Graphs For Financial Analysis PPT Structure AT deck, guaranteed to leave a lasting impression on your audience. Crafted with a perfect balance of simplicity, and innovation, our deck empowers you to alter it to your specific needs. You can also change the color theme of the slide to mold it to your companys specific needs. Save time with our ready made design, compatible with Microsoft versions and Google Slides. Additionally, its available for download in various formats including JPG, JPEG, and PNG. Outshine your competitors with our fully editable and customized deck.
-
Financial Summary Using Graphs PPT Graphics AT
Do not compromise on a template that erodes your messages impact. Introducing our engaging Financial Summary Using Graphs PPT Graphics AT complete deck, thoughtfully crafted to grab your audiences attention instantly. With this deck, effortlessly download and adjust elements, streamlining the customization process. Whether you are using Microsoft versions or Google Slides, it fits seamlessly into your workflow. Furthermore, it is accessible in JPG, JPEG, PNG, and PDF formats, facilitating easy sharing and editing. Not only that you also play with the color theme of your slides making it suitable as per your audiences preference.
-
Financial Data Bar Graphs For Budgeting And Forecasting PPT Structure AT
Step up your game with our enchanting Financial Data Bar Graphs For Budgeting And Forecasting PPT Structure AT deck, guaranteed to leave a lasting impression on your audience. Crafted with a perfect balance of simplicity, and innovation, our deck empowers you to alter it to your specific needs. You can also change the color theme of the slide to mold it to your companys specific needs. Save time with our ready-made design, compatible with Microsoft versions and Google Slides. Additionally, its available for download in various formats including JPG, JPEG, and PNG. Outshine your competitors with our fully editable and customized deck.
-
Financial Summary Dashboard With Graphs PPT Structure AT
Ditch the Dull templates and opt for our engaging Financial Summary Dashboard With Graphs PPT Structure AT deck to attract your audience. Our visually striking design effortlessly combines creativity with functionality, ensuring your content shines through. Compatible with Microsoft versions and Google Slides, it offers seamless integration of presentation. Save time and effort with our pre designed PPT layout, while still having the freedom to customize fonts, colors, and everything you ask for. With the ability to download in various formats like JPG, JPEG, and PNG, sharing your slides has never been easier. From boardroom meetings to client pitches, this deck can be the secret weapon to leaving a lasting impression.
-
Integrating EBITDA Graphs With Other Financial Metrics PPT Structure AT
Ditch the Dull templates and opt for our engaging Integrating EBITDA Graphs With Other Financial Metrics PPT Structure AT deck to attract your audience. Our visually striking design effortlessly combines creativity with functionality, ensuring your content shines through. Compatible with Microsoft versions and Google Slides, it offers seamless integration of presentation. Save time and effort with our pre designed PPT layout, while still having the freedom to customize fonts, colors, and everything you ask for. With the ability to download in various formats like JPG, JPEG, and PNG, sharing your slides has never been easier. From boardroom meetings to client pitches, this deck can be the secret weapon to leaving a lasting impression.
-
0914 graphs on tablet modern tools for financial planning stock photo
We are proud to present our 0914 graphs on tablet modern tools for financial planning stock photo. This image is in .jpg format and is available in size 2500x2000. This image displays graph on tablet. This image has been designed to display graph representations in your presentations. Use this image, in your presentations to express views on financial growth and marketing. Create eye-catching presentations using this image.
-
Financial markets analysis with pie chart and bar graphs
Presenting this set of slides with name - Financial Markets Analysis With Pie Chart And Bar Graphs. This is a three stage process. The stages in this process are Bull Market, Financial Markets, Stock Market.
-
Pitch deck to raise funding from short term financial graph historical and projection
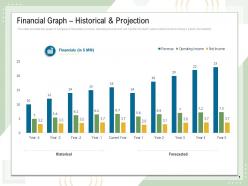
The slide provides the graph of companys financials revenue, operating income and net income for the current year and the coming 4 years forecasted Deliver an outstanding presentation on the topic using this Pitch Deck To Raise Funding From Short Term Financial Graph Historical And Projection. Dispense information and present a thorough explanation of Financial Graph Historical And Projection using the slides given. This template can be altered and personalized to fit your needs. It is also available for immediate download. So grab it now.
-
Monthly Financial Graph With Operating Profit And Cost Of Goods Sold
This slide showcases monthly analytics for to keep company finances organized and identify problem areas. It further includes details about marketing, professional fees, COGS and other operations. Presenting our well structured Monthly Financial Graph With Operating Profit And Cost Of Goods Sold. The topics discussed in this slide are Financial, Marketing, Professional. This is an instantly available PowerPoint presentation that can be edited conveniently. Download it right away and captivate your audience.
-
Financial graph for current and quick ratio comparison
Introducing our Financial Graph For Current And Quick Ratio Comparison set of slides. The topics discussed in these slides are Financial Graph For Current And Quick Ratio Comparison. This is an immediately available PowerPoint presentation that can be conveniently customized. Download it and convince your audience.
-
0514 global sales and net revenue financial graphic diagram
Compatibility across various software versions available online and offline. Professionally equipped and articulated set of visuals and information. Wide screen projection does not affect the output adversely. Easy to edit and customize PPT graphics. Precise and easy to comprehend information on PPT sample. Increase the level of personalization with your company logo and name. Compatible with all software and can be saved in any format i.e. jpeg or pdf.
-
Financial graph historical and projection revenue operating year powerpoint presentation graphic tips
The slide provides the graph of companys financials revenue, operating income and net income for last 5 years historical and coming 4 years forecasted. Presenting this set of slides with name Financial Graph Historical And Projection Revenue Operating Year Powerpoint Presentation Graphic Tips. The topics discussed in these slides are Revenue, Operating Income, Net Income. This is a completely editable PowerPoint presentation and is available for immediate download. Download now and impress your audience
-
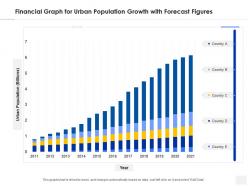
Financial graph for urban population growth with forecast figures
Introducing our Financial Graph For Urban Population Growth With Forecast Figures set of slides. The topics discussed in these slides are Financial Graph For Urban Population Growth With Forecast Figures. This is an immediately available PowerPoint presentation that can be conveniently customized. Download it and convince your audience.
-
Building Effective Financial Dashboards PPT Graphics AT
Step up your game with our enchanting Building Effective Financial Dashboards PPT Graphics AT deck, guaranteed to leave a lasting impression on your audience. Crafted with a perfect balance of simplicity, and innovation, our deck empowers you to alter it to your specific needs. You can also change the color theme of the slide to mold it to your companys specific needs. Save time with our ready made design, compatible with Microsoft versions and Google Slides. Additionally, its available for download in various formats including JPG, JPEG, and PNG. Outshine your competitors with our fully editable and customized deck.
-
Powerpoint template and background with eco financial graph decrease
Templates act as productivity boosters as they help in getting more work done in a lesser time frame. They are also great design frameworks with everything pre designed. This Powerpoint Template And Background With Eco Financial Graph Decrease is one such layout that can help you meet your goals and expectations in no time. It will provide you with great design elements that are suitable for any scenario consulting marketing sales personal agenda or any other. Not only this but this template layout will help you navigate the most important ideas and streamline your way of presenting. With everything pre laden and fully equipped this design is an absolute steal. The high resolution graphics and images used will empower your message and catch the audiences attention in minutes thereby helping you deliver inspiring presentations. The biggest advantage of this template is that it can be manipulated as per your business understanding. So feel free to adjust it to your terms and conditions once you click on the download button.
-
Financial graph historical and projection investment pitch to raise funds from mezzanine debt ppt elements
The slide provides the graph of companys financials revenue, operating income and net income for last 5 years historical and coming 4 years forecasted. Present the topic in a bit more detail with this Financial Graph Historical And Projection Investment Pitch To Raise Funds From Mezzanine Debt Ppt Elements. Use it as a tool for discussion and navigation on Financial Graph Historical and Projection. This template is free to edit as deemed fit for your organization. Therefore download it now.
-
Financial graph historical and projection investor pitch deck for hybrid financing ppt ideas
The slide provides the graph of companys financials revenue, operating income and net income for last 5 years historical and coming 4 years forecasted. Present the topic in a bit more detail with this Financial Graph Historical And Projection Investor Pitch Deck For Hybrid Financing Ppt Ideas. Use it as a tool for discussion and navigation on Financial Graph Historical And Projection. This template is free to edit as deemed fit for your organization. Therefore download it now.
-
Financial Ratio Benchmarks by Industry PPT Graphics VA
Every stakeholder meeting hinges on credible numbers yet raw financial data often fails to resonate across departments. You need industry context that transforms scattered metrics into persuasive arguments. This presentation deck translates complex financial ratio benchmarks by industry into clear actionable visual stories perfect for CFO reviews or board updates. With editable slides you can quickly customize data visualization to reflect your sector. These PPT slides blend modern slide design with straightforward presentation graphics helping you secure buy in without drowning audiences in spreadsheets. Make your next corporate presentation the one where critical ratios finally click for everyone in the room.
-
Financial graph historical and projection mezzanine capital funding pitch deck ppt ideas templates
The slide provides the graph of companys financials revenue, operating income and net income for last 5 years historical and coming 4 years forecasted.Deliver an outstanding presentation on the topic using this Financial Graph Historical And Projection Mezzanine Capital Funding Pitch Deck Ppt Ideas Templates. Dispense information and present a thorough explanation of historical, forecasted, revenue, operating income, net income using the slides given. This template can be altered and personalized to fit your needs. It is also available for immediate download. So grab it now.
-
Green Money Essentials Sustainable Financial Growth PPT Graphics AT
Ditch the Dull templates and opt for our engaging Green Money Essentials Sustainable Financial Growth PPT Graphics AT deck to attract your audience. Our visually striking design effortlessly combines creativity with functionality, ensuring your content shines through. Compatible with Microsoft versions and Google Slides, it offers seamless integration of presentation. Save time and effort with our pre-designed PPT layout, while still having the freedom to customize fonts, colors, and everything you ask for. With the ability to download in various formats like JPG, JPEG, and PNG, sharing your slides has never been easier. From boardroom meetings to client pitches, this deck can be the secret weapon to leaving a lasting impression.
-
Template with 3d rendered rainbow colored financial graph showing strong growth
Templates act as productivity boosters as they help in getting more work done in a lesser time frame. They are also great design frameworks with everything pre designed. This Template With 3d Rendered Rainbow Colored Financial Graph Showing Strong Growth is one such layout that can help you meet your goals and expectations in no time. It will provide you with great design elements that are suitable for any scenario consulting marketing sales personal agenda or any other. Not only this but this template layout will help you navigate the most important ideas and streamline your way of presenting. With everything pre laden and fully equipped this design is an absolute steal. The high resolution graphics and images used will empower your message and catch the audiences attention in minutes thereby helping you deliver inspiring presentations. The biggest advantage of this template is that it can be manipulated as per your business understanding. So feel free to adjust it to your terms and conditions once you click on the download button.
-
Financial graph historical and projection net income ppt powerpoint presentation file icon
The slide provides the graph of companys financials revenue, operating income and net income for last 5 years historical and coming 4 years forecasted. Presenting this set of slides with name Financial Graph Historical And Projection Net Income Ppt Powerpoint Presentation File Icon. The topics discussed in these slides are Revenue, Operating Income, Net Income. This is a completely editable PowerPoint presentation and is available for immediate download. Download now and impress your audience.
-
Credit Analysis Fundamentals For Financial Professionals PPT Graphics AT
Do not compromise on a template that erodes your messages impact. Introducing our engaging Credit Analysis Fundamentals For Financial Professionals PPT Graphics AT complete deck, thoughtfully crafted to grab your audiences attention instantly. With this deck, effortlessly download and adjust elements, streamlining the customization process. Whether you are using Microsoft versions or Google Slides, it fits seamlessly into your workflow. Furthermore, it is accessible in JPG, JPEG, PNG, and PDF formats, facilitating easy sharing and editing. Not only that you also play with the color theme of your slides making it suitable as per your audiences preference.
-
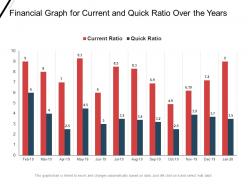
Financial graph for current and quick ratio over the years
Presenting this set of slides with name Financial Graph For Current And Quick Ratio Over The Years. The topics discussed in these slides are Current Ration, Quick Ration. This is a completely editable PowerPoint presentation and is available for immediate download. Download now and impress your audience.
-
Dices on financial graph powerpoint icon s
Microsoft PowerPoint Template and Background with dices on financial graph
-
Financial Reporting Key Principles For Accurate Financial PPT Graphics AT
Do not compromise on a template that erodes your messages impact. Introducing our engaging Financial Reporting Key Principles For Accurate Financial PPT Graphics AT complete deck, thoughtfully crafted to grab your audiences attention instantly. With this deck, effortlessly download and adjust elements, streamlining the customization process. Whether you are using Microsoft versions or Google Slides, it fits seamlessly into your workflow. Furthermore, it is accessible in JPG, JPEG, PNG, and PDF formats, facilitating easy sharing and editing. Not only that you also play with the color theme of your slides making it suitable as per your audiences preference.
-
Financial Stock Market Analysis Insights PPT Graphics AT
While your presentation may contain top-notch content, if it lacks visual appeal, you are not fully engaging your audience. Introducing our Financial Stock Market Analysis Insights PPT Graphics AT deck, designed to engage your audience. Our complete deck boasts a seamless blend of Creativity and versatility. You can effortlessly customize elements and color schemes to align with your brand identity. Save precious time with our pre-designed template, compatible with Microsoft versions and Google Slides. Plus, its downloadable in multiple formats like JPG, JPEG, and PNG. Elevate your presentations and outshine your competitors effortlessly with our visually stunning 100 percent editable deck.
-
Grab Services Overview Ride Hailing To Financial PPT Graphics AT
Do not compromise on a template that erodes your messages impact. Introducing our engaging Grab Services Overview Ride Hailing To Financial PPT Graphics AT complete deck, thoughtfully crafted to grab your audiences attention instantly. With this deck, effortlessly download and adjust elements, streamlining the customization process. Whether you are using Microsoft versions or Google Slides, it fits seamlessly into your workflow. Furthermore, it is accessible in JPG, JPEG, PNG, and PDF formats, facilitating easy sharing and editing. Not only that you also play with the color theme of your slides making it suitable as per your audiences preference.
-
Economies Of Scale Elements Internal Technological Marketing Financial Managerial Graph Companies
It has PPT slides covering wide range of topics showcasing all the core areas of your business needs. This complete deck focuses on Economies Of Scale Elements Internal Technological Marketing Financial Managerial Graph Companies and consists of professionally designed templates with suitable graphics and appropriate content. This deck has total of twelve slides. Our designers have created customizable templates for your convenience. You can make the required changes in the templates like colour, text and font size. Other than this, content can be added or deleted from the slide as per the requirement. Get access to this professionally designed complete deck PPT presentation by clicking the download button below.
-
Dynamic Finance Graphs For Budgeting Insights PPT Summary AT
Step up your game with our enchanting Dynamic Finance Graphs For Budgeting Insights PPT Summary AT deck, guaranteed to leave a lasting impression on your audience. Crafted with a perfect balance of simplicity, and innovation, our deck empowers you to alter it to your specific needs. You can also change the color theme of the slide to mold it to your companys specific needs. Save time with our ready made design, compatible with Microsoft versions and Google Slides. Additionally, its available for download in various formats including JPG, JPEG, and PNG. Outshine your competitors with our fully editable and customized deck.
-
Conservative Portfolio Funding Allocation Graph Financial Portfolio Expansion
Mentioned slide provides information about conservative options for funding allocations. It includes funding options, percentage of fund allocation, and various asset class examples to invest in. Deliver an outstanding presentation on the topic using this Conservative Portfolio Funding Allocation Graph Financial Portfolio Expansion Dispense information and present a thorough explanation of Conservative Asset Allocation, Investment Avenues, Percentage using the slides given. This template can be altered and personalized to fit your needs. It is also available for immediate download. So grab it now.
-
Balance Portfolio Funding Allocation Graph Financial Portfolio Expansion
Mentioned slide provides information about balance options for funding allocation. It includes funding allocation graph, various investment avenues, percentage of funding allocation, and asset classes. Present the topic in a bit more detail with this Balance Portfolio Funding Allocation Graph Financial Portfolio Expansion Use it as a tool for discussion and navigation on Investment Avenues, Percentage, Asset Classes This template is free to edit as deemed fit for your organization. Therefore download it now.
-
Financial targets graphical representation
Presenting this set of slides with name Financial Targets Graphical Representation . This is a three stage process. The stages in this process are Financial Target, Financial Target Objectives, Financial Targets Sales. This is a completely editable PowerPoint presentation and is available for immediate download. Download now and impress your audience.
-
Financial Action Plan Overview PPT Graphics AT
Ditch the Dull templates and opt for our engaging Financial Action Plan Overview PPT Graphics AT deck to attract your audience. Our visually striking design effortlessly combines creativity with functionality, ensuring your content shines through. Compatible with Microsoft versions and Google Slides, it offers seamless integration of presentation. Save time and effort with our pre-designed PPT layout, while still having the freedom to customize fonts, colors, and everything you ask for. With the ability to download in various formats like JPG, JPEG, and PNG, sharing your slides has never been easier. From boardroom meetings to client pitches, this deck can be the secret weapon to leaving a lasting impression.
-
Financial Comparison For Business Growth PPT Graphics AT
Step up your game with our enchanting Financial Comparison For Business Growth PPT Graphics AT deck, guaranteed to leave a lasting impression on your audience. Crafted with a perfect balance of simplicity, and innovation, our deck empowers you to alter it to your specific needs. You can also change the color theme of the slide to mold it to your companys specific needs. Save time with our ready-made design, compatible with Microsoft versions and Google Slides. Additionally, its available for download in various formats including JPG, JPEG, and PNG. Outshine your competitors with our fully editable and customized deck.
-
0314 annual financial growth graph
Deploy slides in all compatible software evenly. Hassle-free download and usage of slide. Company logo, trademark or name can be inserted for extra customization. PowerPoint graphics do not pixelate upon projection on widescreen. All slides compatible with google slides for more online reach. Highly customized layout including font, text, color and design. Include titles and sub titles with zero space constraints.
-
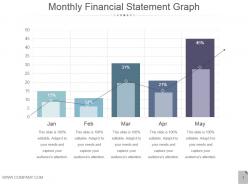
Monthly financial statement graph ppt examples slides
Presenting monthly financial statement graph ppt examples slides. This is a monthly financial statement graph ppt examples slides. This is a two stage process. The stages in this process are jan, feb, mar, apr, may.