


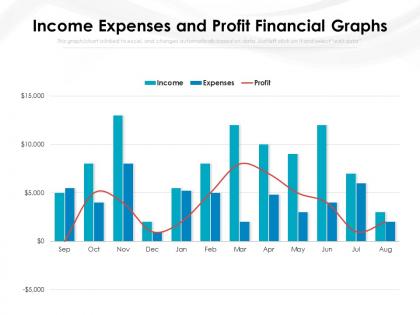
Income expenses and profit financial graphs




Try Before you Buy Download Free Sample Product
 Impress Your
 Audience
 100%
100% Editable
 Save Hours
 of Time


Our Income Expenses And Profit Financial Graphs are explicit and effective. They combine clarity and concise expression.
People who downloaded this PowerPoint presentation also viewed the following :
Income expenses and profit financial graphs with all 2 slides:
Give your audience a fulfilling experience. They will find our Income Expenses And Profit Financial Graphs elevating.

FAQs for Income expenses and
Hey! So there's basically four types of ratios you should look at. Liquidity ones (like current ratio) show if a company can actually pay their bills right now. Then you've got profitability ratios - ROE, profit margins, that stuff - which is pretty obvious what they measure. Debt ratios are huge though, because I've seen too many companies that looked great until you realized they were drowning in debt. Asset turnover and other efficiency ratios tell you if management's actually doing their job well or just coasting. Start there, then go deeper depending on what you're really trying to figure out.
Look, cash flow analysis shows you when money actually lands in your account vs just sitting there as IOUs. Super helpful for catching those gaps between what customers owe you and what you need to pay suppliers. Weekly tracking beats those quarterly reports any day - you'll see patterns way clearer. It helps with timing decisions too, like whether to hold off on buying equipment or hassling customers for faster payments. Honestly, once you start watching your cash conversion cycle, you'll see exactly where money gets tied up. Game changer for avoiding those "oh crap, payroll's due" moments.
So trend analysis is basically your way of spotting patterns in old financial data to guess what's coming next. Look at stuff like revenue growth, expenses, seasonal ups and downs - you need at least 3-5 years of data to see real patterns. Obviously it's not perfect (finance never is), but it gives you something solid to work with. I always think it works best when you mix it with other forecasting methods too. Just watch out for external stuff that might mess with historical trends - like, who saw 2020 coming, right? But yeah, it's a good starting point for predictions.
Dude, macro stuff can totally flip your whole analysis upside down. A decent company might look sketchy if rates are spiking, or some mediocre stock could seem brilliant during a boom. Fed announcements literally move everything - it's crazy how one speech changes your entire model. GDP growth hits revenues, inflation crushes margins, currency moves wreck international plays. Don't just analyze the company by itself. I always run at least 2-3 different economic scenarios when I'm putting together my final pitch, otherwise you're kinda flying blind.
Look, you can't judge your numbers in a vacuum. That 15% profit margin might seem okay until you realize your competitors are pulling 25% - yikes. Grab financials from 3-5 similar companies and compare the big stuff: ROE, debt ratios, gross margins. This'll show you if your problems are just yours or if the whole industry's struggling. Honestly, investors are doing this comparison whether you do it or not, so might as well beat them to it. Plus you'll catch trends early and figure out where you actually stand.
Ugh, accounting standard changes are such a pain when you're doing financial analysis. They totally screw up your year-over-year comparisons because companies either restate old numbers or change how they report going forward. So you'll see these weird jumps in metrics that have nothing to do with actual business performance - super misleading. I always dig into the footnotes when I spot something that looks off. MD&A sections usually explain what's happening too. You've got to adjust your analysis to separate the accounting noise from real operational changes, otherwise you're basically analyzing accounting tricks instead of the actual business.
Excel's still king - you'll live in that thing. Bloomberg Terminal's what everyone uses for market data, plus FactSet or Refinitiv for financial modeling. Python and R are clutch for data analysis and automating boring stuff. Tableau and Power BI are solid for charts and dashboards. Honestly, I know analysts doing million-dollar valuations in Excel because why fix what works, right? You might also see QuickBooks for accounting or Capital IQ for company research. My advice? Get scary good at Excel formulas and pivot tables first. That's your bread and butter no matter where you end up working.
So sensitivity analysis is basically stress-testing your numbers to see what breaks first. Like, what happens if your sales tank by 20% or costs go crazy? It's wild how much one variable can mess everything up. The whole point is figuring out which assumptions actually matter so you're not wasting time worrying about the small stuff. I'd honestly just pick your three biggest risks and run scenarios on those - way better than getting caught off guard later. Plus you can actually plan for the bad stuff instead of just crossing your fingers.
So working capital is just current assets minus current liabilities - basically shows if a company can pay its bills. I've watched profitable companies crash because they couldn't handle cash flow properly, it's wild. Seasonal businesses especially get tricky here. Don't just look at one snapshot though - you'll want to track trends over time. If it's dropping consistently? That's when you know something's up with their cash management. Oh, and growing companies can be deceiving too since they burn through cash fast.
Look, financial analysis is basically your cheat sheet for not making terrible investment decisions. Instead of just winging it, you can actually dig into a company's profits, cash flow, and how much debt they're drowning in. The ratios show you stuff that isn't obvious from just reading headlines or whatever. Comparing different stocks becomes so much easier when you have real numbers to work with. I mean, some of these ratios can be pretty boring to calculate, but they're worth it. Red flags pop out way faster, and you'll spot good opportunities too. Just focus on the metrics that actually matter for what you're trying to do.
Okay so vertical analysis is when you compare everything to one base number in the same period - like making everything a percentage of total revenue. Horizontal tracks those same items across multiple time periods. Think of it this way: vertical shows you the snapshot structure at one moment. What percentage of sales went to marketing? Horizontal reveals trends over time - is marketing spend growing faster than revenue each year? I honestly think you need both since they tell completely different stories. Usually I'll check horizontal first to catch any trends, then dig into vertical to figure out what's actually driving those changes. Makes way more sense that way.
So basically, financial statements help you figure out where you're hemorrhaging cash or just sucking at efficiency. Pull your last three years of data and calculate ratios like inventory turnover and receivables days - compare them to industry standards. The cash flow statement is gold though, seriously. You might look profitable on paper but still be burning through actual cash (seen it happen way too often). Don't get hung up on single quarters. Trends over time tell the real story. Start with those efficiency ratios - they'll point you toward the biggest problems first.
Here's what's worked for me - clean up your historical data first because messy data will screw everything up. Don't rely on just one forecasting model; run a few different ones and see where they agree. Rolling forecasts beat those yearly ones hands down since you're updating constantly. Track your forecast errors religiously - I know it sounds boring but you'll catch patterns fast. Pull in outside stuff too like industry trends or economic indicators, not just your internal numbers. Test your models against real results regularly and adjust when they start going sideways. Honestly, most people skip the error tracking part but it's where the real insights are.
So basically, non-financial metrics show you the "why" behind your numbers - they predict what's gonna happen before it shows up in your financials. Customer satisfaction, employee turnover, market share, that kind of stuff. Your financial statements just tell you what already went down. But if you see high turnover this quarter? It might not hurt profits yet, but you'll definitely feel it later in hiring costs and dropped productivity. I honestly think most companies ignore these way too much. Use both together and you can actually see what's coming instead of just reacting to yesterday's news.
Be brutally honest with your data - don't cherry-pick stuff just because your boss won't like it. I've watched analysts get burned for "massaging" numbers, and it kills your reputation fast. Document everything clearly so people can actually verify what you did. Upfront disclosure is huge too - mention your assumptions, where the data's weak, any conflicts you might have. Use solid sources and watch out for biased samples. Oh, and think about who gets hurt by your analysis beyond just the obvious stakeholders. Short version: if you can't defend your methodology, you're doing it wrong.
No Reviews