


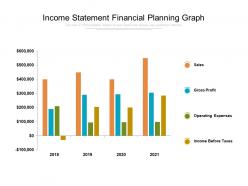
Income statement financial planning graph


Try Before you Buy Download Free Sample Product
 Impress Your
 Audience
Editable
of Time


Encourage discussions in an amicable environment with our Income Statement Financial Planning Graph. Be an advocate of civilized debate.
People who downloaded this PowerPoint presentation also viewed the following :
Income statement financial planning graph with all 2 slides:
Advocate good debate with our Income Statement Financial Planning Graph. Encourage free and fair discussions.

FAQs for Income statement
So you've got three main parts: revenue, expenses, and net income. Start with total revenue - all money coming in. Subtract cost of goods sold, boom, that's gross profit. Operating expenses come next (salaries, rent, marketing, whatever keeps things running). Don't forget other random income/expenses plus taxes. Think of it like your personal budget on steroids, honestly. The whole thing flows top to bottom, which is actually pretty helpful once you get it. Net income sits at the very bottom - that's your real profit. Oh, and each section connects to tell your company's money story.
So the income statement covers a period - like a month or quarter - and shows if you made money or lost it. Revenue minus expenses, basically. The balance sheet? That's different. It's a snapshot of one moment showing what you own vs what you owe. Think of it like this: income statement tells you how you performed, balance sheet shows where you stand right now. Honestly, you need both to get the full picture since they work together. The income statement is more about the story, the balance sheet is about your current position. Don't try analyzing your business with just one - you'll miss half the info.
Honestly, operating income is the number I look at first when checking out a company. It shows you how the actual business is doing without all the weird accounting stuff or one-time events messing with the picture. Net income can be super misleading - like if they sold a building or got some random tax break. But operating income? That's just the core business performance. I compare it quarter to quarter and year over year to see if there's a real trend happening. Way better for judging if management actually knows what they're doing. Start there, then dig into the other stuff if you want.
So these basically hit your net income straight up - no cushion or anything. Interest payments, random asset losses, currency stuff that goes sideways. Pretty annoying since they're not even from your actual business but still trash your bottom line. Here's the thing though - you definitely want to separate these out when you're looking at how you're actually performing. Otherwise you might think your core business is doing worse (or better) than it really is. Honestly, I always flag these separately when I'm showing numbers to anyone important. One weird forex loss can make a good quarter look terrible.
So gross profit is basically what's left after you pay for making your stuff - before rent, salaries, all that other business crap hits. It's super important because it shows if your core product actually makes money. Like, are you selling $5 sandwiches that cost $6 to make? That's a problem. When I look at businesses, shrinking margins usually mean pricing issues or your costs are getting out of hand. You can compare it month-to-month or see how you stack up against competitors. Honestly, it's one of those numbers that'll save your butt if you pay attention to it.
Think of revenue trends as your crystal ball for future income statements. They show where your business is actually going. Look at patterns across quarters or years - you'll catch seasonal swings, growth rates, all that market stuff that hits your top line. Honestly, it's one of the better forecasting tricks out there. Once you get those trends down, you can figure out how expenses will move with revenue and what your profit margins might look like. Oh, and check both percentage growth AND dollar amounts - gives you way more realistic assumptions for projections.
EBIT strips away all the financing and tax stuff to show you how the actual business is doing. So you're not getting distracted by whether they took on debt or what tax breaks they got. It's like comparing two restaurants based on their food quality, not their rent payments or whatever tax loopholes they found. Really handy when you're looking at companies that finance things differently or operate in different states/countries. I use it all the time for peer comparisons - way cleaner than net income for figuring out which company actually runs their operations better.
Ugh, accounting policy changes are such a pain when you're trying to compare years. Like if a company switches from FIFO to weighted average inventory - suddenly their numbers look totally different even though nothing actually changed in the business. Revenue recognition changes mess things up too. Honestly, I've been burned by this before when doing analysis. But here's the thing - companies have to disclose these changes in their footnotes, and they'll usually restate old numbers. So always dig into those footnotes first before you start panicking about weird trends.
Honestly, the worst mistakes are usually timing issues with revenue recognition - that stuff trips everyone up. Don't mix operating and non-operating expenses either. Also, stay consistent with how you categorize things between periods. Like, don't randomly switch how you classify certain costs halfway through the year. Depreciation calculations are another nightmare - I swear half the errors I see come from that. Keep extraordinary items out of your regular operating income too. Oh, and always double-check that your net income matches up with your cash flow statement. Trust me, making a quick checklist beforehand saves so much headache later.
Look, income statements are where you wanna start - they show if a company's actually profitable or just bleeding money. Revenue trends jump out at you pretty quick, plus you can see if their expenses are spiraling. Profit margins tell the real story though. I always check this first before diving into balance sheets and cash flow stuff. Once you've got that foundation, dig into the ratios and see what's driving everything. It's honestly like checking the pulse before doing a full physical exam, you know?
So the income statement shows revenue, expenses, and profit over a set time period - think of it as a snapshot of how well they're actually making money. I always check this first when looking at stocks. You can spot if sales are growing, costs are under control, and profits stay consistent. Look for trends and seasonal stuff too. Honestly, some companies look way better until you dig into these numbers. Compare it to past quarters to see the real story. Just don't use it alone - pair it with balance sheet and cash flow data for the full picture.
So basically single-step just throws everything together - you get total revenue minus total expenses and boom, net income. Multi-step breaks it all down though. You'll see gross profit, operating expenses, cost of goods sold as separate lines. Way more detailed. It separates your actual business operations from random other income too, which is honestly pretty useful. If you're just doing basic bookkeeping, single-step works fine. But investors love the multi-step format since they can actually see where your money's coming from and going to. Makes your business look more legit too.
So depreciation basically spreads out big asset costs instead of slamming your books all at once. Like if you buy a $100k machine, you don't expense the whole thing immediately - you'd split it over 10 years at $10k annually. Makes way more sense for matching expenses with the revenue that equipment actually generates. Here's the weird part though: it's not real cash leaving your account each year, just a paper expense that lowers your reported profits. I always found that confusing at first. But yeah, your cash flow stays untouched while your P&L takes the hit.
Honestly, I'd grab their last few annual reports and throw together a basic spreadsheet to compare stuff over 3-5 years. Don't just look at dollar amounts - percentages are way more telling. Track how their gross margin, operating margin, and net profit margin change over time. Revenue growth matters too, obviously. The real question is whether they're getting better or worse at turning sales into actual profit. Are margins expanding or shrinking? That's the story right there. Sometimes I get a bit obsessed with this stuff, but watching those trends really shows you if a company's fundamentally improving or just riding a wave.
Dude, you gotta compare your ratios to other companies in your space - it's the only way to know if you're actually doing well or just kidding yourself. Look at gross margin, operating margin, and how much you're blowing on expenses as a percentage of revenue. Are your profit margins terrible compared to everyone else? Is your revenue growth sluggish while competitors are crushing it? I mean, some of this stuff seems obvious but you'd be surprised how many people skip this step. It's basically like checking your test score against the class average. Once you see where you're lagging, you can figure out what's broken operationally.
No Reviews