Income Forecast PowerPoint Presentation Slides
Try Before you Buy Download Free Sample Product
Audience
Editable
of Time
Our Income Forecast PowerPoint Presentation Slides are topically designed to provide an attractive backdrop to any subject. Use them to look like a presentation pro.
People who downloaded this PowerPoint presentation also viewed the following :
Content of this Powerpoint Presentation
Slide 1: This slide introduces Income Forecast. State Your Company Name and begin.
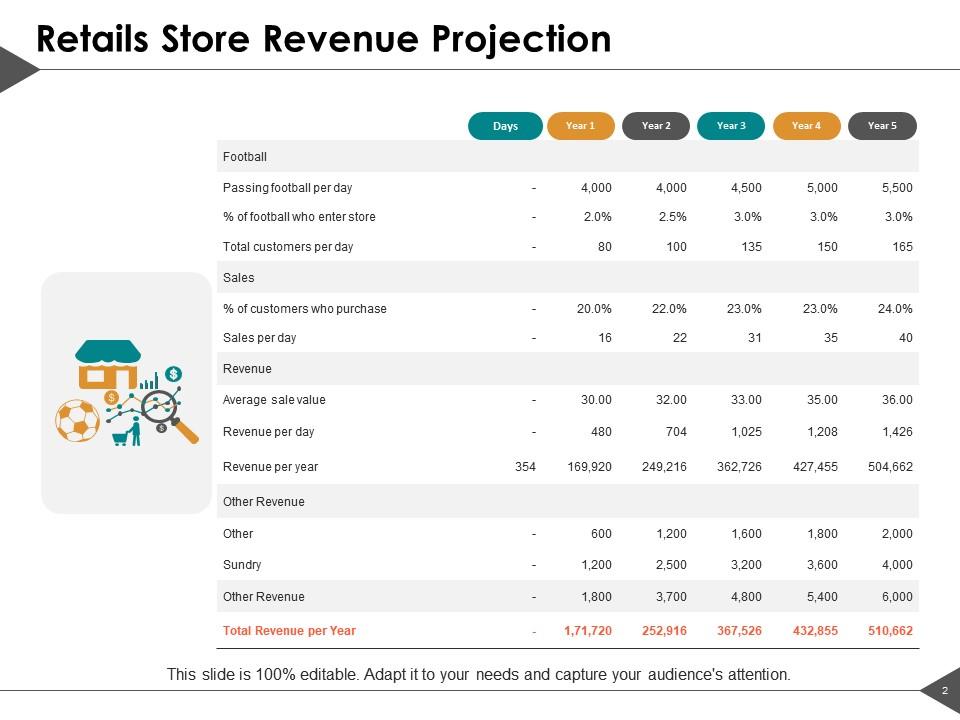
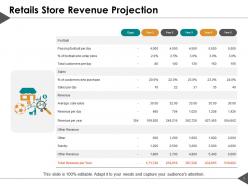
Slide 2: This slide shows Retails Store Revenue Projection describing- customers per day, sales, revenue, etc.
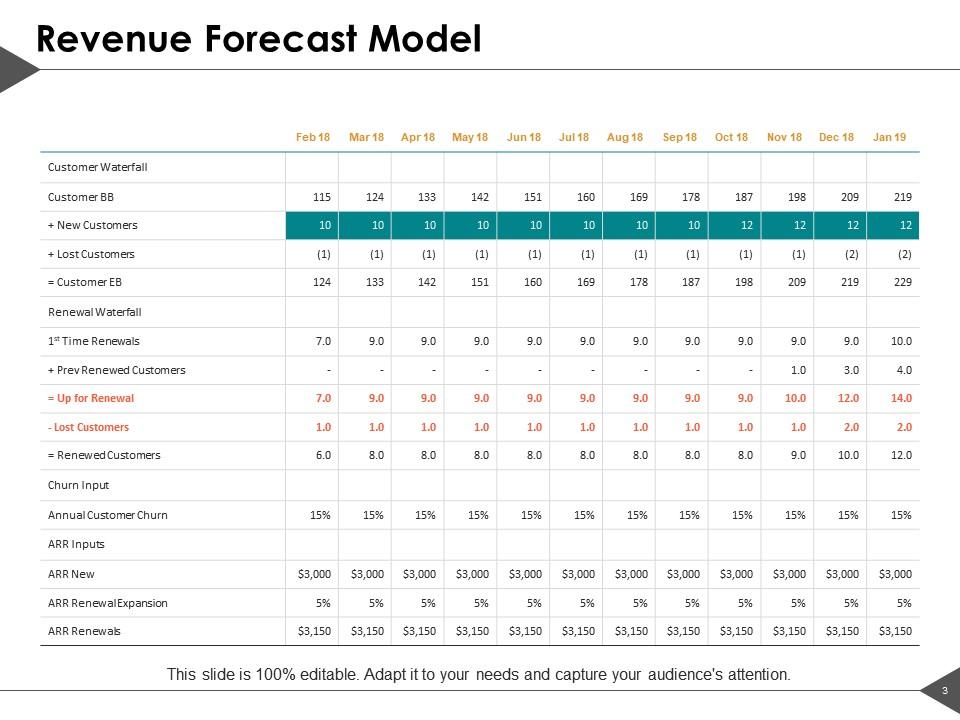
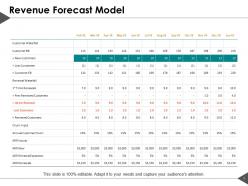
Slide 3: This slide presents Revenue Forecast Model describing- Customer waterfall, renewal waterfall, churn input, annual customer churn etc.
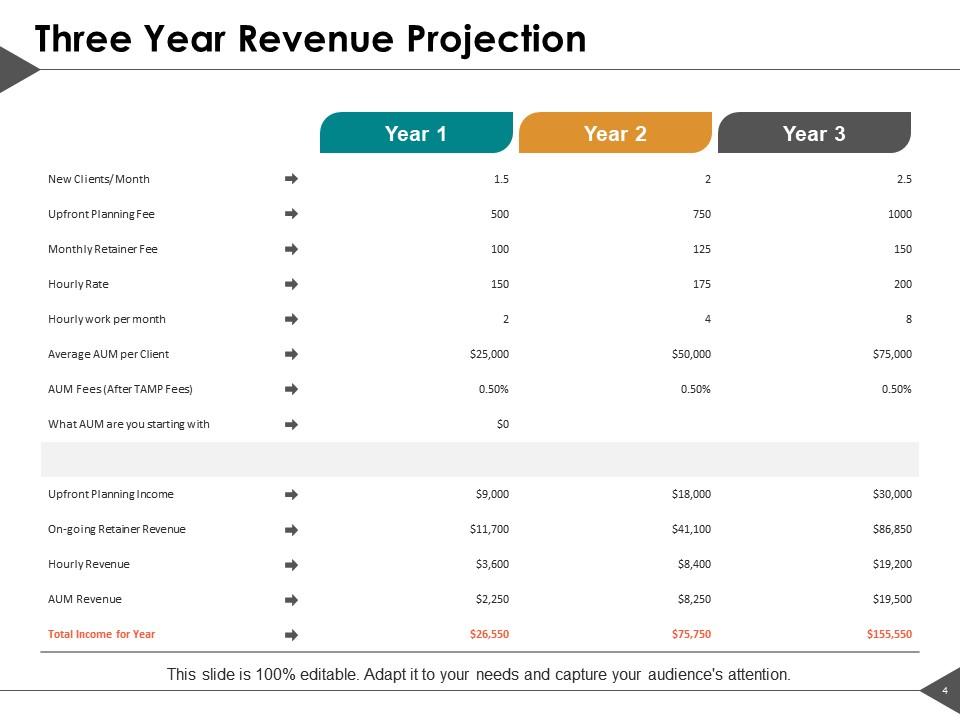
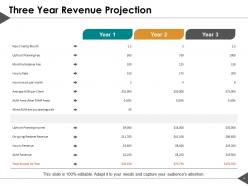
Slide 4: This slide displays Three Year Revenue Projection describing- New clients, upfront planning fee, monthly retainer fee, upfront planning income etc.
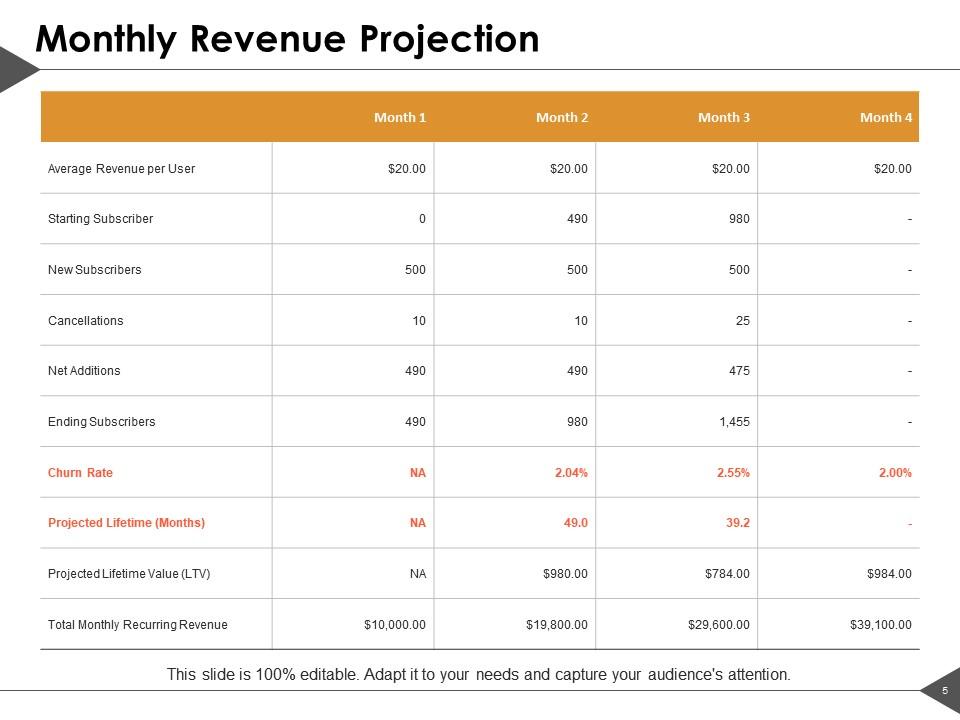
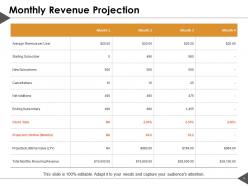
Slide 5: This slide represents Monthly Revenue Projection describing- average revenue per user, starting subscriber, new subscribers, Net additions,churn rate etc.
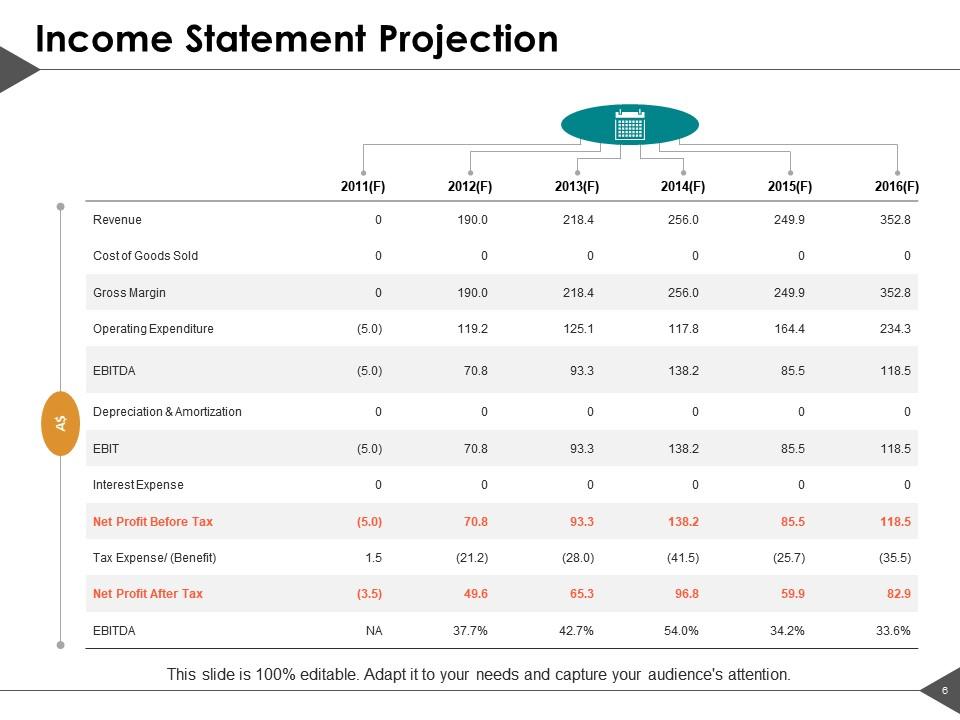
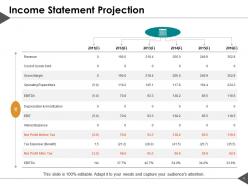
Slide 6: This slide showcases Income Statement Projection describing- Revenue, cost of goods sold, gross margin, operating expenditure etc.
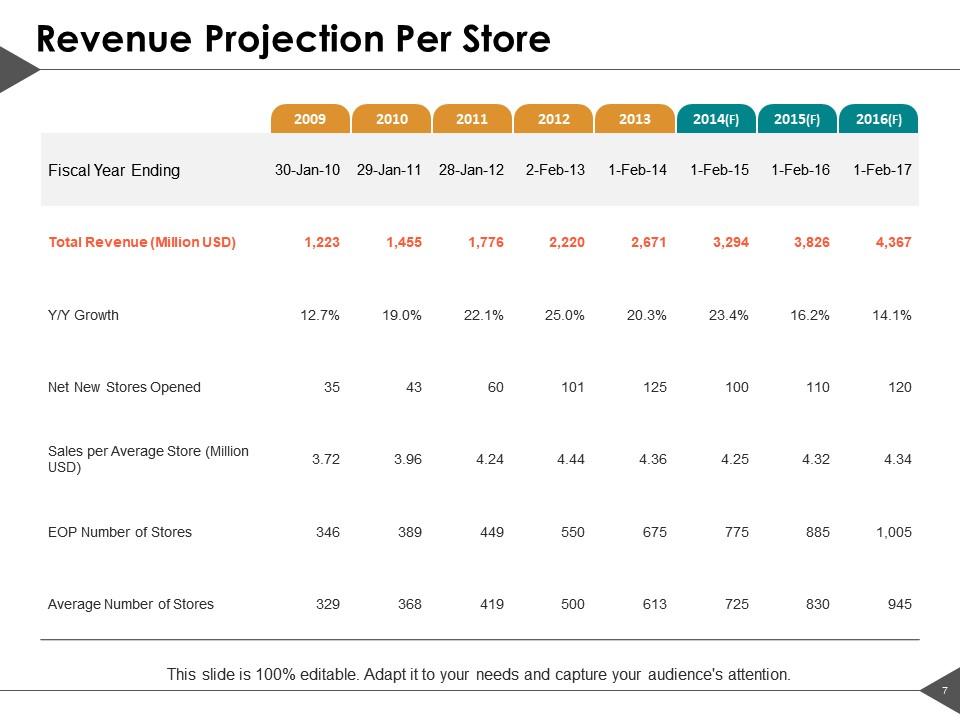
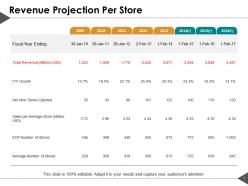
Slide 7: This slide shows Revenue Projection Per Store describing- Total revenue, net new stores opened, sales per average store etc.
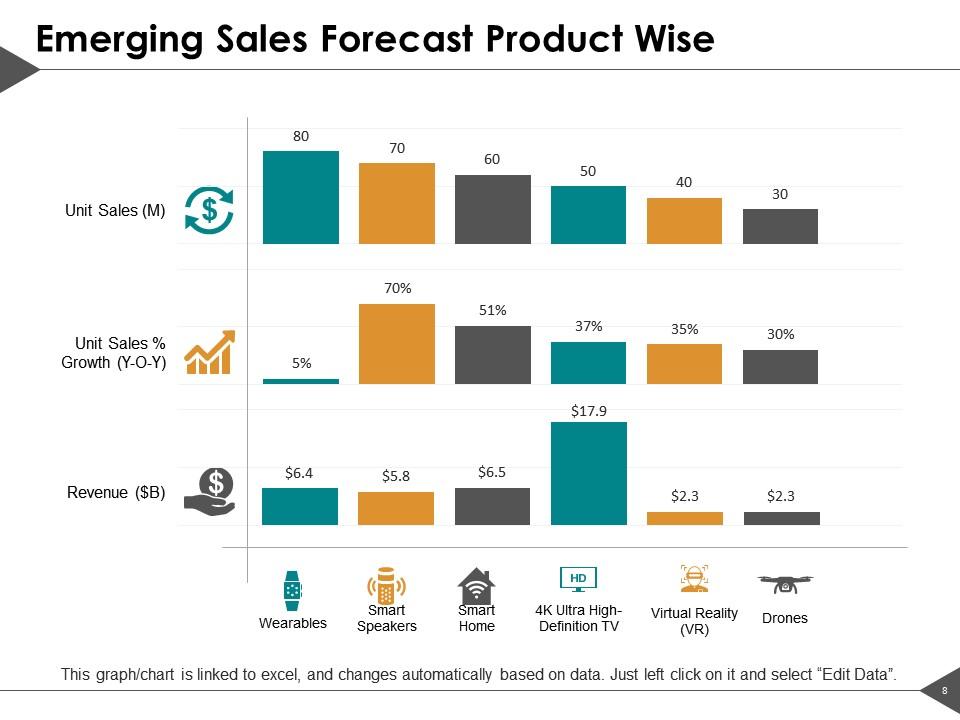
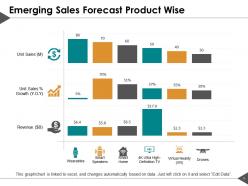
Slide 8: This slide presents Emerging Sales Forecast Product Wise describing- Unit Sales % Growth, Revenue, Unit Sales.
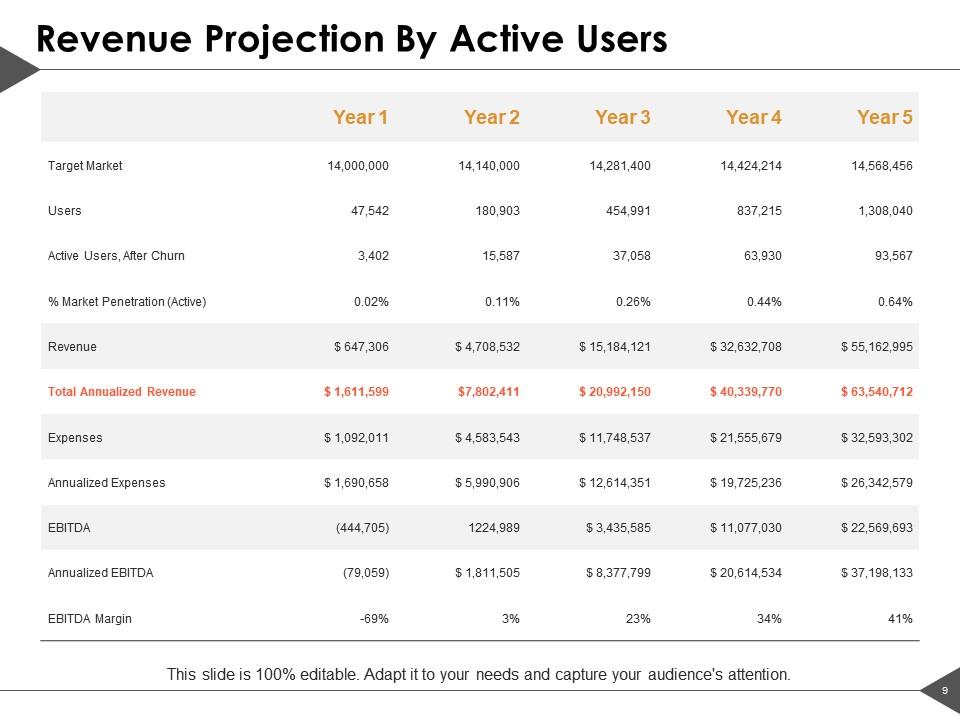
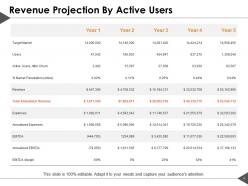
Slide 9: This slide displays Revenue Projection by Active users describing- Target market, users, Revenue, expenses etc.
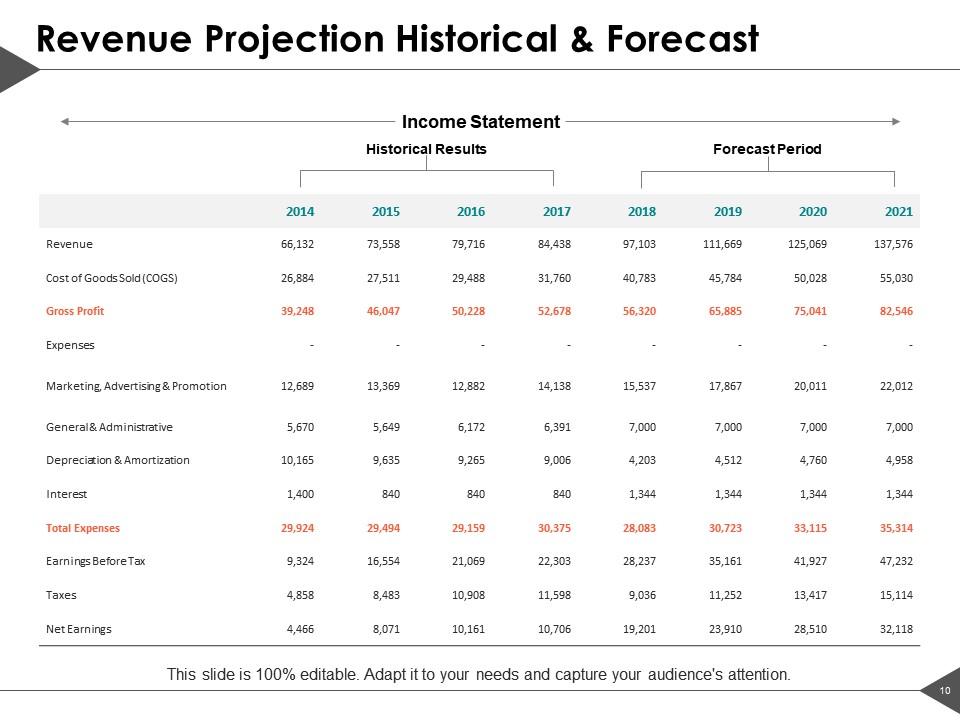
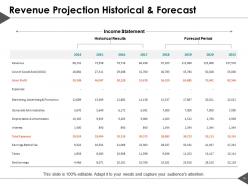
Slide 10: This slide represents Revenue Projection Historical & Forecast with Income statement, Historical results and forecast period.
Slide 11: This slide is titled as Additional Slides for moving forward.
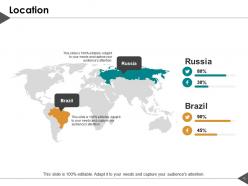
Slide 12: This is a location slide with maps to show data related with different locations.
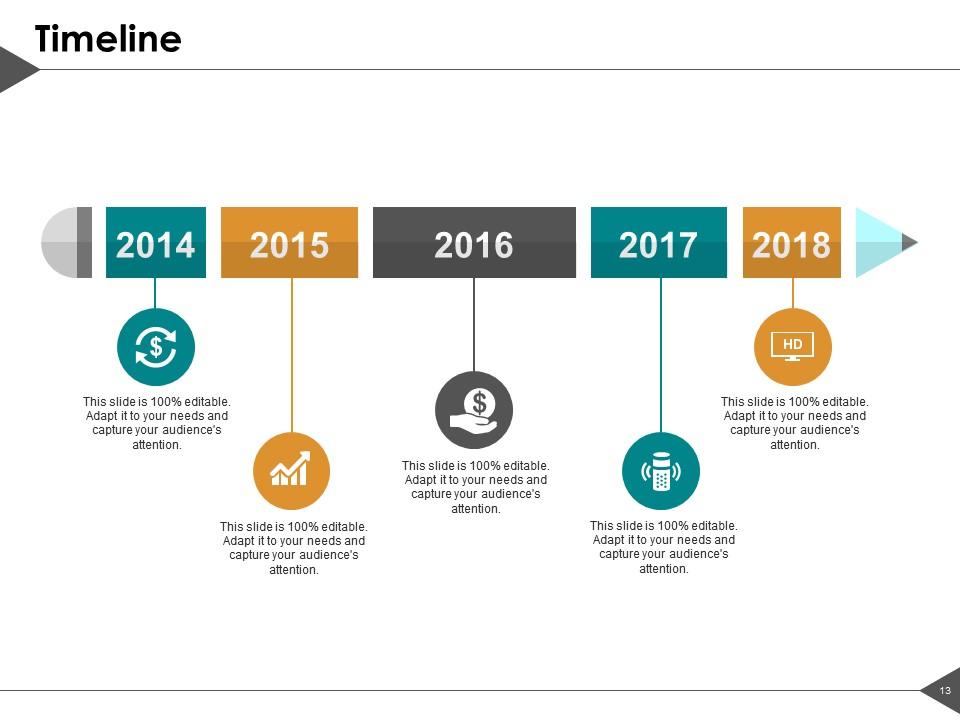
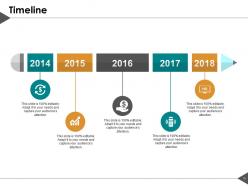
Slide 13: This is a Timeline slide. Show information related with time period here.
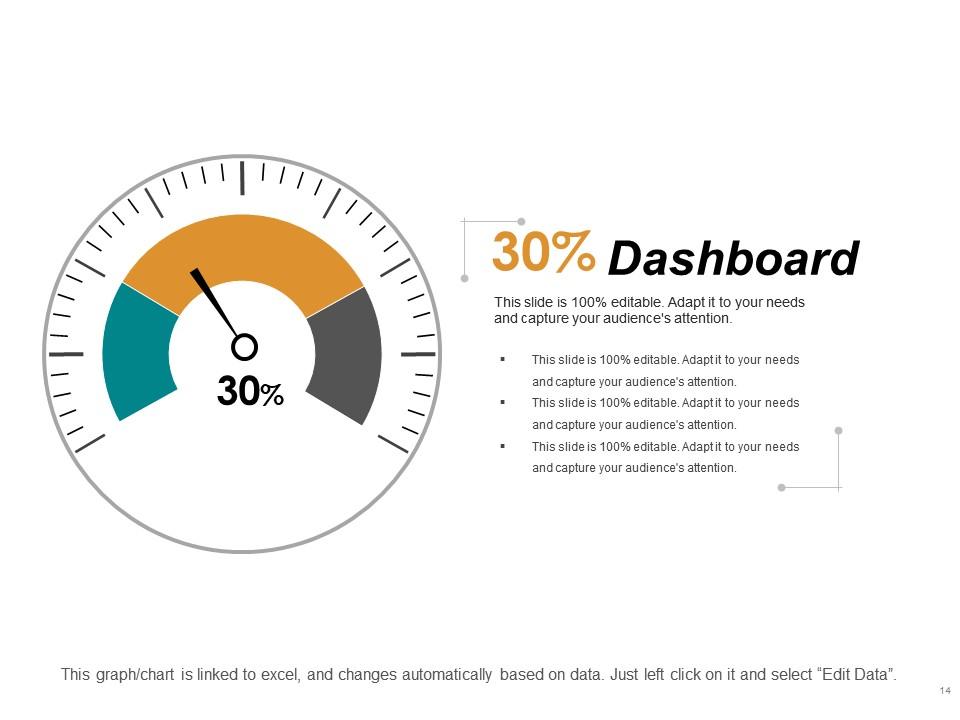
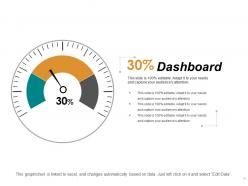
Slide 14: This is a Dashboard slide with text boxes to show information.
Slide 15: This slide shows post it notes. Post your important notes here.
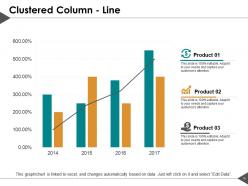
Slide 16: This slide shows clustered column line chart with three products comparison.
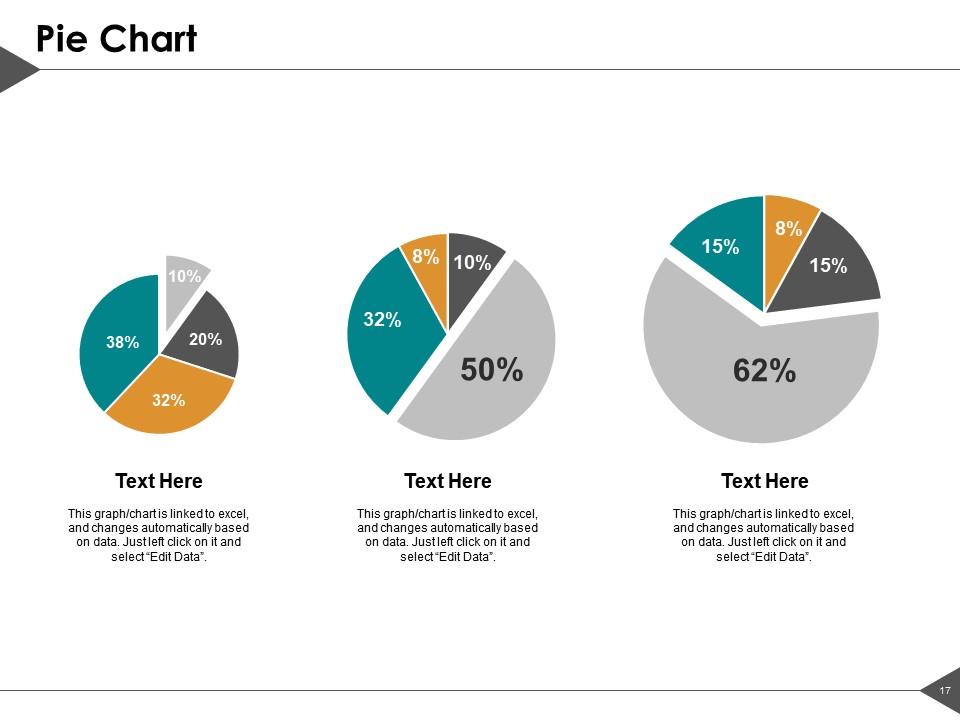
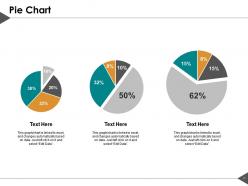
Slide 17: This slide shows Pie charts with additional text boxes.
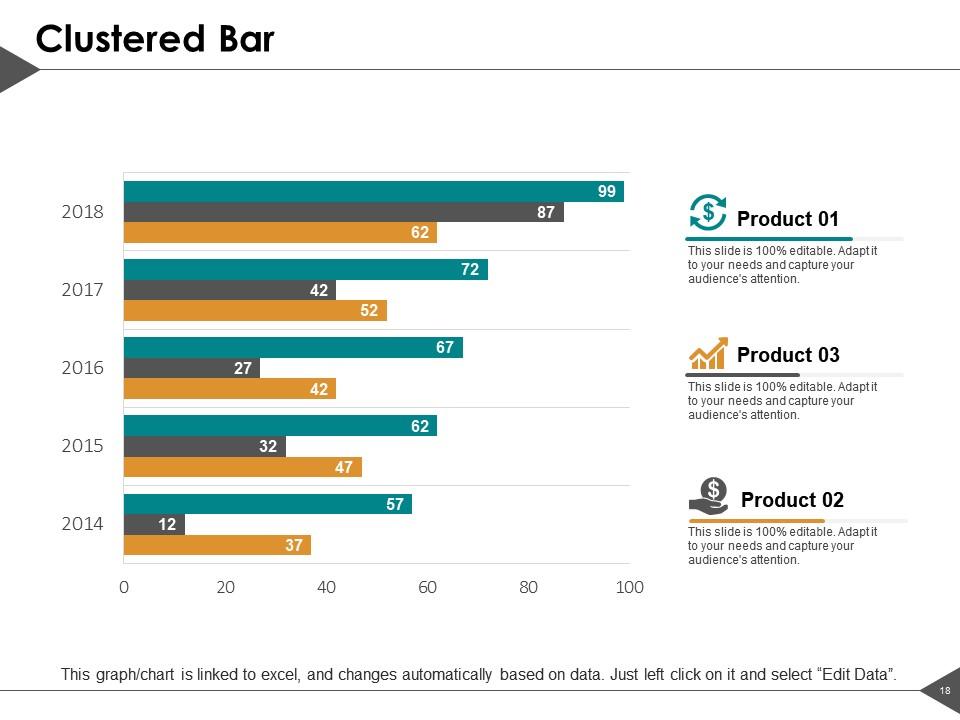
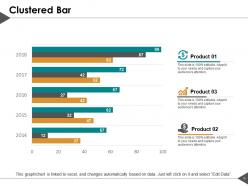
Slide 18: This slide shows clustered bar graph chart with three products comparison.
Slide 19: This is a Thank you slide with address, contact numbers and email address.
Income Forecast PowerPoint Presentation Slides with all 19 slides:
Use our Income Forecast PowerPoint Presentation Slides to effectively help you save your valuable time. They are readymade to fit into any presentation structure.
FAQs for Income Forecast
Honestly, I'd start simple with your last 2-3 years of revenue data - look for patterns and seasonal stuff. Bottom-up works great (add up individual revenue streams), but also try top-down using market projections to double-check yourself. Don't overthink it with crazy complex models right away, that's where people usually mess up. Factor in your current pipeline and any big changes you know are coming. Market conditions matter too, obviously. Always do three scenarios - best case, realistic, and oh-shit-everything-goes-wrong. Keeps you ready for whatever actually happens.
So basically, your old financial records are like a crystal ball for predicting future income. You'll start noticing patterns - maybe December is always your best month, or things get weird every summer. I'd grab at least 2-3 years of data if you've got it lying around. Plot out those monthly numbers and watch for your peaks and valleys. Also pay attention to your growth rates over time. Honestly, once you see the trends, you'll stop being surprised when revenue drops in February (again). Just remember that big changes in your business might throw off those historical patterns.
Honestly, market analysis is like your reality check before you get too excited about income projections. Look at what competitors are actually making, check industry trends, and see what customers really want - not just what you think they want. Economic indicators matter too, though they can be pretty boring to dig through. Without this stuff, you're basically throwing darts blindfolded. I've seen too many people get burned by wildly optimistic forecasts that ignored market conditions. Pull some industry reports and competitor data first - it'll save you from looking ridiculous later when your projections are way off.
So basically, you want to watch economic indicators because they'll tell you where your income's headed. GDP growth and unemployment rates? Those show if people will actually spend money. Inflation's another big one - it hits everyone's wallet differently. Interest rates are honestly the most important though, since they control how much businesses invest and whether consumers can afford to borrow. I usually check consumer confidence first since it predicts changes before they actually happen. Housing starts are solid too. Just focus on whatever indicators matter most for your industry and update your forecasts every few months when new data drops.

Dude, honestly the worst thing you can do is assume everything will grow in a straight line - like that ever happens. Timing's always way more optimistic than reality, and people constantly forget about seasonal dips. Your customers will churn more than you think, payments come in late, competitors do annoying stuff. Plus market conditions change overnight sometimes. I always tell people to start with their nightmare scenario first, then build up from there. Sounds depressing but it actually works better. Throw in some decent buffers and update things monthly at least. Way better than getting blindsided later.
Dude, forecasting software is a total game-changer. It pulls data automatically and spots trends you'd miss doing spreadsheets manually. The algorithms crunch historical patterns, seasonal stuff, even market conditions - way more than your brain could handle. Real-time updates are clutch too, so you're not stuck waiting for month-end reports to realize something's off. I'd start simple though - grab something that plays nice with whatever accounting setup you've got. My buddy tried going too fancy right away and it was a mess. You'll see improvements pretty much immediately without drowning in complexity.
Start with your big assumptions right off the bat - market growth, pricing shifts, customer costs, whatever drives your numbers. Show three scenarios because honestly, single forecasts look naive now. Break things down monthly or quarterly instead of just yearly chunks. Graphs beat tables every time for exec presentations, trust me on that one. Include your methodology so people can actually follow your thinking. Here's the thing though - call out the major risks that could torpedo everything. Execs love that honesty and it shows you're not just throwing numbers at the wall.
Look at your last 2-3 years of sales data first - that'll show you the patterns. Retail goes crazy in Q4 with holiday shopping, tax prep companies basically die after April, tourism explodes in summer. Construction workers hate winter for obvious reasons. Agriculture? Total rollercoaster based on harvest seasons. The thing is, if you ignore these cycles your forecasts will be completely off. You'll think you're crushing it during slow months or panic during what should be your peak times. Honestly, seasonal businesses are wild - one quarter you're swimming in cash, next quarter you're wondering where everyone went.
MAPE is probably your best bet here - it shows percentage error which makes way more sense for income stuff than raw numbers. MAE and RMSE work too but honestly MAPE just clicks better. The real trick though? Watch for bias patterns. If your model keeps guessing too high or too low, that's a red flag. I'd also check how stable your forecasts are over time - like, are they all over the place month to month? That's usually a sign something's broken. Start with MAPE, then dig into the bias stuff. Trust me on this one.
Look, scenario planning is just building out different "what-if" situations instead of banking on one forecast. Create a few versions - best case, worst case, something realistic in between. Way smarter than just winging it and hoping everything goes perfect (spoiler: it won't). Pick 3-4 things that actually move the needle on your income, then map out how those could shift. Different market conditions, customer weirdness, economic stuff. You'll spot problems before they blindside you and can pivot faster. Honestly beats stressing about one number that's probably wrong anyway.
Look, your stakeholders are literally sitting on the info you need. Sales knows if that pipeline is actually real or just wishful thinking. Marketing sees demand shifts before they hit your numbers. Finance catches budget issues you'd never spot from your desk. Getting them involved early saves you from those awkward "wait, we never signed off on this" meetings later - trust me on that one. You'll catch your blind spots and get everyone on board at once. Just ask specific questions though. Those vague brainstorming sessions? Total time suck and you'll get nothing useful.
Yeah, regulatory stuff can totally mess up your income predictions - especially in healthcare, finance, energy, those heavy-regulation industries. New compliance rules usually jack up your costs. Deregulation though? That might open doors or bring more competition. Banking's a perfect example - when capital requirements change, banks can't lend as much so their interest income drops. Policy changes are super unpredictable honestly, they just appear overnight sometimes. I'd build different scenario models for potential shifts. Oh and definitely stay connected to industry groups or regulatory news so you can pivot your forecasts fast when announcements drop.
Honestly, just start with Excel or Google Sheets - most teams still use them anyway and they work fine for basic stuff. Cube or Jirav are pretty sweet for smaller companies since they actually play nice with your accounting software. If you're dealing with enterprise-level chaos, Adaptive Insights and Anaplan are solid choices with better team features. Oh, and Prophix is decent too. Don't go crazy with fancy tools if a simple spreadsheet does the job though. You can always upgrade later when things get messier and you actually need the bells and whistles.
Look, income forecasting is basically your financial crystal ball - helps you make smarter decisions about where to put your money. You'll avoid those panic moments when cash runs low (trust me, not fun). Knowing what's coming in lets you plan big purchases, new hires, or equipment upgrades without guessing. Honestly, I think most people skip this step and just wing it. Spot potential problems early and you can pivot before things get messy. Start by looking at your revenue patterns from the last few quarters - that's your foundation right there.
Yeah, consumer sentiment works pretty well for income forecasting actually. People feel good about the economy, they spend more, businesses make money, wages go up. Basic stuff but it works. COVID really showed how fast sentiment can flip everything upside down. I'd track those confidence indices with your other data - sentiment usually shifts before the hard numbers do, which is super helpful. Works best for retail and service sectors. Don't make it your main thing though, just use it as one piece of the puzzle. It's really good at catching those turning points early when other metrics are still lagging behind.
-
Visually stunning presentation, love the content.
-
Awesome presentation, really professional and easy to edit.
-
Great designs, Easily Editable.
-
Great designs, really helpful.