

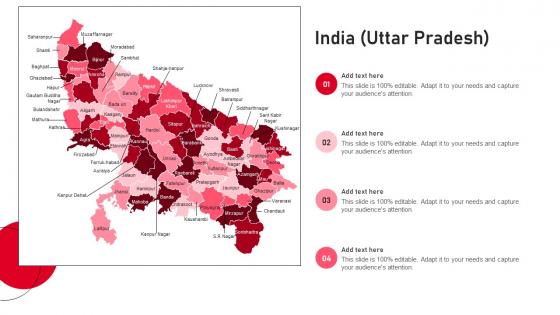
India Uttar Pradesh PU Maps SS




Try Before you Buy Download Free Sample Product
 Impress Your
 Audience
 100%
100% Editable
 Save Hours
 of Time


Our India Uttar Pradesh PU Maps SS are topically designed to provide an attractive backdrop to any subject. Use them to look like a presentation pro.
People who downloaded this PowerPoint presentation also viewed the following :
India Uttar Pradesh PU Maps SS with all 9 slides:
Use our India Uttar Pradesh PU Maps SS to effectively help you save your valuable time. They are readymade to fit into any presentation structure.








FAQs for India Uttar Pradesh
Okay so there's basically a few different types you'll want to check out. Political ones show all 75 districts plus major cities like Lucknow and Kanpur - really helpful for understanding how the state's organized. Physical maps are great too since they highlight the Gangetic plains and rivers like Ganga and Yamuna. Most people don't realize UP actually has some hilly areas down south, which is kinda interesting. You've also got road maps for highways and transport, plus specialized ones covering agriculture and population stuff. Honestly I'd grab a combo political-physical map first to get oriented, then look into the specific thematic ones depending on what you're actually researching.
So basically, political maps show you all the man-made stuff - district boundaries, cities, the 75 districts of UP, roads, that kind of thing. Physical maps are more about actual geography like rivers, mountains, the Gangetic plains. Honestly? You'll probably need the political one way more often since most people are dealing with administrative boundaries and government stuff. Physical maps are cool if you're into geography, but they won't help you figure out which district you're in or find the nearest town. I'd start with political unless you specifically need terrain info for some reason.
Dude, you really need topo maps for UP - they're game changers. Political maps are basically useless because they don't show elevation or terrain. With topo maps, you can actually see the Gangetic plains spread across the state and how everything slopes down from the Himalayas. River valleys become obvious too. It's wild how much sense everything makes once you see the elevation changes - like why certain spots flood every year or why some areas grow way better crops. Settlement patterns, roads, development projects... they all follow the terrain. Trust me, check the topography first and you'll avoid so much head-scratching later.
Choropleth maps work great for UP demographics - just color-code districts by whatever you're looking at (population density, literacy rates, age groups, etc). Dark colors for high concentrations, light for low. Since UP has 75 districts, you've got tons of data points to play with which actually makes the patterns pop more. Dot density maps are solid for population stuff too. One tip though - stick to one variable per map. I tried cramming multiple demographics once and it looked like a rainbow threw up. Census data's your best starting point, and honestly UP's massive size is perfect for this kind of thing.
Dude, those old UP maps are fascinating! The Ganges was basically India's main highway back then - everything flowed along that river system. You can literally trace how empires like the Mauryans and Mughals expanded by following those waterways and trade routes. Cities like Varanasi and Allahabad didn't become major centers by accident; they were positioned perfectly at these crucial crossroads. What's wild is how the agricultural patterns shaped where people settled, which then influenced political boundaries for centuries. Honestly, if you're diving into any Indian history period, start with geography first - it'll make all the political moves way clearer.
Dude, you absolutely need solid road maps for any UP planning work. They show existing infrastructure and traffic flows, plus where cities connect to rural areas - super important in a state that huge. I'd use them to spot where new roads should go and plan transit routes. Also helps you figure out the best spots for hospitals, schools, whatever based on how accessible they are. Quick heads up though - make sure your maps are recent since UP's infrastructure changes fast. Without decent road data you're basically just winging it on development priorities.
So obviously the Taj Mahal's the big one in Agra, plus Agra Fort and Fatehpur Sikri nearby. Varanasi's all over these maps for the Ganges ghats - though honestly they make it look way less chaotic than it really is lol. You'll see Lucknow for Bara Imambara, Ayodhya for Ram Janmabhoomi, and Prayagraj where those three rivers meet. Mathura-Vrindavan shows up for Krishna stuff, Sarnath for Buddhist sites. Just a heads up - UP is absolutely huge so try to group things by area or you'll be driving forever.
Dude, digital mapping totally changed how I look at UP real estate. You can pull up satellite imagery, zoning info, transportation data - it's crazy how much is available now. I usually start with one district and map out development projects for the next 5 years. Layer different datasets like population growth and government initiatives. The trick is spotting undervalued areas near future metro lines or IT hubs before everyone else catches on. Takes some getting used to though - I was pretty overwhelmed when I first started digging into all the data.
Dude, climate maps are seriously useful for UP farming. Different districts have totally different conditions - west is semi-arid, east gets humid. You'll see rainfall patterns, temp zones, when to plant what. My cousin ignored this stuff last year and his wheat timing was completely off. These maps show optimal sowing dates and irrigation needs for your exact area. Short story - check your district's latest climate data before planning next season. Way better than guessing and losing money on wrong varieties or bad timing.
Maps are honestly a lifesaver when teaching UP geography! Your students can actually see where Lucknow sits compared to Kanpur, or trace how the Ganges cuts through the state. Way more engaging than textbook reading. I'd get a big wall map where kids can walk up and point stuff out - they remember district boundaries and river systems so much better. Digital ones work too, but there's something about physically moving around that clicks. Oh, and have them create their own maps of cultural regions - my students always loved that part!
Ugh, this is gonna be a pain honestly. Rapid urbanization means boundaries change constantly, and different government departments never have their data synced up. Plus the place is absolutely massive. Rural areas often don't have proper documentation, so good luck getting reliable ground-truth data. Infrastructure develops so fast that your satellite imagery might be useless within months - I learned this the hard way on a previous project. Old survey records are a mess too. Disputed boundaries between districts will slow you down. Cross-reference multiple official sources and definitely budget extra time for field verification.
So maps are huge for cultural tourism in UP! They're in all the brochures and apps, plus those big station boards (when they're not completely sun-bleached lol). Visitors use them to find the Taj, Varanasi ghats, Lucknow monuments - you know, the big draws. The tourism dept has interactive digital ones now that group UNESCO sites and archaeological stuff together, which is pretty smart. They show hotels and restaurants too so people can actually plan their trips. Honestly, if you're doing heritage promotion, themed maps work great - like grouping by time periods or architectural styles. Way more useful than generic tourist maps.
Dude, UP's using some really advanced mapping tech right now. ISRO's Cartosat satellites are capturing crazy detailed terrain data, and they're combining that with LiDAR for 3D urban mapping. Drones are everywhere too - tracking infrastructure changes in real time. AI helps process all the geospatial stuff way faster than before. Honestly, the drone footage is probably my favorite part since you can see everything happening as it happens. GIS platforms tie it all together for urban planning. Oh, and definitely check out the UP Bhunaksha portal if you need current land records - it's actually pretty user-friendly for government tech.
Crime maps are pretty useful for UP cities - they show cops where problems cluster so they can actually put officers in the right spots. Like, you'll see hotspots in places like Lucknow's busy markets or Kanpur's factory areas. Smart patrols during peak hours make a huge difference. City planners use the data too - maybe they'll realize an area needs better lighting or isn't safe because it's too isolated. Residents can check these maps before heading out, which is honestly smart. The trick is making sure departments actually act on the data instead of just collecting it.
Dude, those old UP maps are actually pretty cool for tracking economic shifts. Trade routes moved around, cities either boomed or totally faded away. Railways completely changed how commerce worked - you can literally see it happening on the maps. Colonial maps are wild because they show what the Brits cared about most. Settlement patterns, road expansion, where they were pulling resources from. Canal systems really boosted farming too. Honestly, comparing maps from different decades is your best bet - the visual timeline makes those transformation patterns super obvious. Way easier than trying to piece it together from text alone.
-
Awesome use of colors and designs in product templates.
-
“I required a slide for a board meeting and was so satisfied with the final result !! So much went into designing the slide and the communication was amazing! Can’t wait to have my next slide!”