


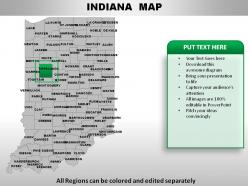
Usa indiana state powerpoint maps





Try Before you Buy Download Free Sample Product
 Impress Your
Audience
 100%
Editable
 Save Hours
of Time


Making your presentations memorable can help keep you ahead of the game. We want to help by offering high quality USA Indiana State Powerpoint Maps.
People who downloaded this PowerPoint presentation also viewed the following :
Usa indiana state powerpoint maps with all 28 slides:
Light the fuse with our USA Indiana State Powerpoint Maps. Blast the audience with the force of your ideas.




FAQs for Usa indiana
Indiana's geographical landscape features the Great Lakes Plain in the north, Central Till Plain covering most of the state, Southern Hills and Lowlands region, the Ohio River boundary, and extensive agricultural flatlands. These diverse terrains enable strategic location advantages for manufacturing, agriculture, and logistics operations, with many businesses finding that Indiana's central position and varied topography deliver competitive shipping access and operational flexibility.
Historical changes in Indiana's borders are reflected through maps showing territorial adjustments from 1800-1816, including the original Northwest Territory boundaries, subsequent state line negotiations with Ohio and Michigan, and the establishment of current borders upon statehood. These cartographic progressions demonstrate territorial evolution, with many educational institutions, museums, and government agencies finding that comparative historical maps effectively illustrate Indiana's geographic and political development over time.
Thematic maps for Indiana's demographics include population density maps, age distribution choropleth maps, income level heat maps, educational attainment visualizations, and ethnic diversity scatter plots. These mapping approaches enhance policy planning by revealing population clusters, economic disparities, and social patterns across counties, with government agencies and researchers finding that visual demographic analysis streamlines resource allocation and targeted program development.
Indiana's transportation routes have evolved from Native American trails to canals, railroads, and modern interstate highways, with each era reshaping commerce and settlement patterns. Historical map overlays enable organizations to visualize this progression through time-lapse visualizations, comparative analysis, and route density studies, with urban planners, logistics companies, and economic development agencies finding that these mapping approaches deliver strategic insights for infrastructure investment, supply chain optimization, and regional growth planning.
State maps serve as foundational tools for Indiana's urban planners, providing essential data on zoning regulations, infrastructure networks, demographic patterns, transportation corridors, and environmental constraints. Cities like Indianapolis, Fort Wayne, and Evansville leverage these comprehensive mapping resources to streamline development approvals, optimize resource allocation, and coordinate regional growth strategies, ultimately delivering more efficient urban expansion and enhanced livability for residents.
Educators can utilize Indiana state maps to enhance geography lessons by teaching topographical features, county boundaries, major cities, transportation networks, and historical landmarks through interactive activities. These visual tools enable students to explore regional economics, population distribution, and cultural diversity across Indiana's districts, while developing spatial reasoning skills and connecting local geography to broader national contexts, ultimately making abstract geographical concepts tangible and memorable.
Different types of maps provide complementary perspectives on Indiana, with political maps showing county boundaries and governmental divisions, physical maps revealing the state's diverse landscapes from Lake Michigan's shoreline to southern hills, and topographic maps displaying elevation changes and terrain features. Together, these mapping approaches enable comprehensive planning for infrastructure development, agricultural zoning, and resource management, with urban planners and environmental agencies finding that layered geographic data enhances decision-making and strategic development initiatives.
Indiana state maps depict natural resources through specialized overlays showing coal deposits, limestone quarries, agricultural zones, water systems, and mineral reserves across different counties. These visual representations enable economic planners, investors, and policymakers to identify strategic development opportunities, optimize resource extraction operations, and attract industries like manufacturing and agriculture, ultimately delivering enhanced regional competitiveness and sustainable economic growth.
Creating visually appealing Indiana state maps requires strategic color coding, clear typography, balanced data density, and intuitive legend placement to ensure maximum readability. These design principles enhance audience engagement by highlighting key regional differences, incorporating recognizable landmarks like Indianapolis and major highways, and maintaining consistent visual hierarchy, ultimately delivering presentations that communicate Indiana's geographic insights with professional clarity and strategic impact.
Indiana's state maps integrate census and survey data through Geographic Information Systems (GIS) that combine demographic statistics, housing data, employment figures, and migration patterns with precise geographic boundaries. These technologies streamline data visualization by layering population density information, economic indicators, and infrastructure changes, ultimately delivering accurate territorial representations that enable government agencies, businesses, and researchers to make informed decisions about resource allocation and strategic planning.
**INPUT**: What technological advancements have influenced the accuracy and detail of modern Indiana state maps? **OUTPUT**: Modern Indiana state maps benefit from GPS technology, satellite imaging, LiDAR scanning, GIS software, and digital surveying equipment, which deliver unprecedented precision in geographic data collection. These technologies streamline cartographic processes by enabling real-time updates, enhanced topographical detail, and seamless integration of demographic information, with many municipal planning departments and transportation agencies finding that automated mapping systems significantly reduce surveying costs while enhancing infrastructure development accuracy.
Interactive state maps enhance user engagement through clickable regions, layered data visualization, zoom functionality, real-time updates, and customizable overlays that allow users to explore Indiana's counties, cities, and geographic features dynamically. These technologies streamline information discovery by enabling targeted exploration, comparative analysis, and personalized data filtering, with educational institutions, tourism boards, and government agencies finding that interactive elements deliver significantly improved user retention and deeper geographic comprehension.
Cartographers creating Indiana maps face challenges including accurately representing diverse topography from sand dunes to limestone caves, balancing detail between dense urban centers like Indianapolis and rural agricultural areas, and managing scale variations across different regions. These complexities require strategic data integration, precise elevation modeling, and careful symbol selection, with many geographic institutions finding that layered digital approaches ultimately deliver enhanced accuracy while maintaining readability for diverse user needs.
Environmental issues in Indiana are represented through specialized thematic maps featuring flood zone boundaries, watershed areas, urban growth patterns, land use classifications, and environmental risk assessments. These maps integrate FEMA flood data, satellite imagery, and geographic information systems to help urban planners, emergency management agencies, and environmental organizations track sprawl impacts, identify vulnerable areas, and develop strategic mitigation plans, ultimately enabling more informed decision-making for sustainable development.
State maps serve as vital educational tools for preserving Indiana's cultural heritage by documenting historical landmarks, archaeological sites, heritage trails, and culturally significant locations across the state. These comprehensive mapping resources enable museums, schools, and cultural institutions to create interactive educational programs, guided heritage tours, and digital preservation initiatives, while helping communities identify and protect at-risk historical sites, ultimately delivering enhanced cultural awareness and sustainable heritage tourism opportunities.
-
Easily Editable.
-
Awesomely designed templates, Easy to understand.