

List of business research ideas ppt examples slides




Try Before you Buy Download Free Sample Product
 Impress Your
 Audience
 100%
100% Editable
 Save Hours
 of Time


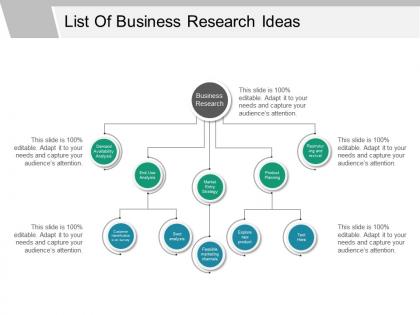
The business research idea PPT template is perfect to demonstrate acquiring detailed information of all the areas of business process and utilizing such information in increasing the sales and profit of the organization. The business study presentation slide helps an organization to determine which product or service is most profitable for them or in demand. The business research methods slide for PowerPoint is ideal for illustrating business concepts that require staging or flow. The project manager always needs to keep an eye on the growth as well as business development in general so he can go for the business research plan template to discuss layout plan as well as communicate the process with the team. Moreover, this business layout design template is suitable for the entrepreneurship process and it will help business startups to present clear data visualization of their organization. By using the business research methodology presentation slide is useful for business organizations and can benefit a lot from leveraging ideas as well as knowledge of processes into constant innovation. The business innovation research template helps to encourage organizations to re-evaluate its status of innovation and research. Inform folks about actions to be carried out with our List Of Business Research Ideas Ppt Examples Slides. Be able to attend to the issue.
People who downloaded this PowerPoint presentation also viewed the following :
List of business research ideas ppt examples slides with all 5 slides:
Doubts don't get a chance to emerge due to our List Of Business Research Ideas Ppt Examples Slides. It ensures folks don't interrupt.

FAQs for List of business research ideas
Effective strategies include mobile-based surveys, local partnership networks, community engagement initiatives, digital ethnography, and hybrid online-offline approaches. These methods address infrastructure limitations, cultural nuances, and trust barriers by leveraging local knowledge, mobile penetration, and culturally-sensitive data collection, with many organizations finding that combining traditional and digital approaches delivers more accurate insights and stronger respondent engagement.
Businesses can leverage social media analytics to inform product development by monitoring customer sentiment, identifying emerging trends, tracking competitor performance, and analyzing engagement patterns across platforms. Through sentiment analysis and trend tracking, companies in retail, technology, and consumer goods can streamline product iterations, enhance feature prioritization, and accelerate time-to-market, ultimately delivering products that better align with customer expectations and market demands.
Customer feedback serves as a critical foundation for strategic decision-making, informing product development, service improvements, market positioning, operational adjustments, and competitive differentiation strategies. Through systematic collection and analysis, organizations across retail, hospitality, and financial services streamline their offerings, enhance customer experiences, and accelerate market responsiveness, ultimately delivering sustained competitive advantage and improved profitability.
Cultural differences significantly impact global market research through varying consumer behaviors, communication styles, data collection preferences, religious considerations, and regulatory frameworks. These variations require businesses to adapt methodologies, localize survey instruments, and employ cultural consultants, with many multinational companies finding that region-specific approaches deliver more accurate insights and competitive advantages.
Mixed-methods approaches combining quantitative surveys, focus groups, behavioral analytics, social media sentiment analysis, and ethnographic observations prove most effective for assessing consumer behavior trends. These methodologies work together by capturing statistical patterns, emotional drivers, and real-world contexts, with retail and financial services organizations finding that integrated data delivers deeper insights and more accurate trend predictions.
Businesses use predictive analytics to forecast market demands by analyzing historical sales data, consumer behavior patterns, seasonal trends, and external market indicators through machine learning algorithms. These insights enable companies to optimize inventory management, adjust pricing strategies, and allocate resources more effectively, with retailers and manufacturers finding significantly improved demand accuracy, reduced stockouts, and enhanced competitive positioning in increasingly dynamic markets.
Business research ethics include informed consent, data privacy protection, participant confidentiality, avoiding deceptive practices, and ensuring voluntary participation without coercion. These principles enhance research credibility while building stakeholder trust, with organizations finding that transparent methodologies and robust data protection ultimately deliver more reliable insights and stronger competitive advantage in increasingly regulated business environments.
Qualitative research complements quantitative data by providing context, uncovering underlying motivations, and explaining the "why" behind numerical trends through interviews, focus groups, and observational studies. This strategic combination enables organizations to make more informed decisions, with many companies finding that qualitative insights help interpret quantitative patterns, ultimately delivering deeper customer understanding and more effective business strategies.
Market success indicators include revenue growth rate, customer acquisition cost, user retention rates, market share expansion, and profitability timelines. These metrics vary significantly across sectors, with SaaS companies focusing on monthly recurring revenue and churn rates, while retail startups prioritize conversion rates and inventory turnover, ultimately delivering competitive positioning insights.
Businesses can assess competitive landscapes through competitor analysis, customer surveys, industry reports, pricing studies, and social media monitoring. These research methods enable organizations to identify market gaps, understand competitor strategies, and benchmark performance across sectors like retail and financial services, ultimately delivering strategic insights that enhance positioning and competitive advantage.
Economic downturns significantly alter consumer purchasing behavior through reduced discretionary spending, increased price sensitivity, brand switching to lower-cost alternatives, delayed major purchases, and heightened focus on essential goods. These shifts create strategic opportunities for businesses offering value-driven products, with many retailers finding that emphasizing affordability, quality, and flexible payment options maintains customer loyalty while capturing new market segments.
Businesses can effectively measure brand perception against competitors through social media sentiment analysis, customer surveys, focus groups, brand tracking studies, and competitive benchmarking tools. These methods enable organizations to assess market positioning, customer loyalty, and messaging effectiveness across industries like retail and financial services, ultimately delivering strategic insights that enhance competitive advantage and optimize marketing investments.
Data visualization tools include Tableau, Power BI, Google Data Studio, Qlik Sense, and D3.js for interactive dashboards and analytics. These platforms streamline complex data interpretation by creating dynamic charts, real-time dashboards, and interactive reports, with many organizations finding that visual data presentation accelerates decision-making and enhances stakeholder communication across departments.
Technology revolutionizes business research by automating data collection, enabling real-time analytics, facilitating remote surveys, and providing advanced visualization tools. Through AI-powered insights and cloud-based platforms, organizations streamline market analysis, enhance customer feedback processes, and accelerate decision-making timelines, ultimately delivering faster, more accurate research outcomes and competitive intelligence.
Businesses quantify research ROI by tracking revenue increases from new products or services, measuring cost reductions through process improvements, and calculating time-to-market acceleration. Through systematic metrics like patent filings, customer acquisition rates, and operational efficiency gains, companies establish clear connections between research investments and financial outcomes, with many organizations finding that structured measurement frameworks deliver measurable competitive advantages.
-
Very unique, user-friendly presentation interface.
-
Easily Editable.