


Monthly Target Powerpoint Ppt Template Bundles




Try Before you Buy Download Free Sample Product
 Impress Your
 Audience
 100%
100% Editable
 Save Hours
 of Time


Introducing our Monthly Targets PowerPoint PPT template, designed to help you track and achieve your monthly goals and objectives effectively. Stay focused and organized with our user-friendly template that allows you to set, monitor, and analyze your monthly targets with ease. Whether you are an individual or a team, this template empowers you to break down your goals into actionable steps, track progress, and make data-driven adjustments along the way. With visually appealing charts, graphs, and customizable slides, you can present your monthly targets and achievements in a clear and impactful manner. Stay motivated, increase productivity, and consistently meet your monthly objectives with our powerful Monthly Targets PPT.
People who downloaded this PowerPoint presentation also viewed the following :
Monthly Target Powerpoint Ppt Template Bundles with all 23 slides:
Use our Monthly Target Powerpoint Ppt Template Bundles to effectively help you save your valuable time. They are readymade to fit into any presentation structure.

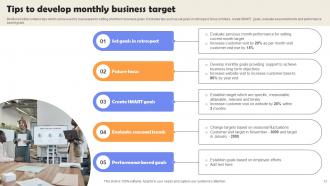
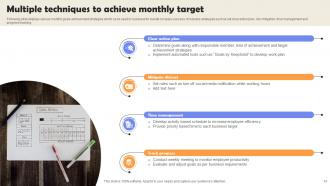






FAQs for Monthly Target Powerpoint
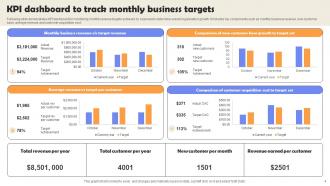
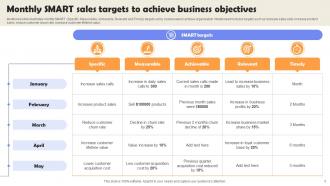
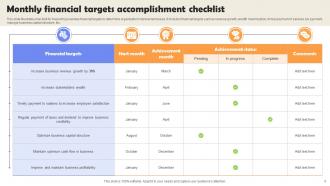
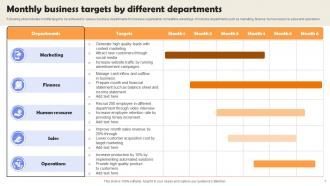
Key elements include target metrics and KPIs, progress tracking charts, performance comparisons against previous months, action plans for underperformance, and stakeholder accountability sections. These components streamline monthly reviews by providing clear visual dashboards, facilitating data-driven discussions, and enabling quick identification of trends, with many organizations finding that structured templates enhance meeting efficiency and ensure consistent performance monitoring across departments.
Visual aids enhance monthly target presentations by improving data comprehension, increasing audience engagement, and facilitating clearer communication of complex metrics and progress indicators. Through well-designed charts, graphs, and infographic elements, organizations streamline information delivery, reduce presentation time, and enable stakeholders to quickly identify trends and performance gaps, ultimately driving more focused discussions and faster decision-making processes.
Best practices for designing visually appealing monthly target templates include using consistent color schemes, clear data visualization charts, balanced white space, readable typography, and logical information hierarchy. These design elements streamline communication by enhancing comprehension, reducing cognitive load, and maintaining professional credibility, with many organizations finding that well-designed templates ultimately deliver faster decision-making and improved team alignment.
Businesses can tailor monthly target templates by customizing metrics, KPIs, visual elements, and reporting frequencies to reflect their industry-specific requirements and operational priorities. Manufacturing companies might emphasize production volumes and quality metrics, while financial services focus on client acquisition and compliance targets, with many organizations finding that industry-aligned templates enhance team engagement and deliver more actionable insights.
Monthly targets presentations should track revenue performance, sales conversion rates, customer acquisition costs, operational efficiency metrics, and team productivity indicators. These measurements enable organizations to assess progress against goals, identify performance gaps, and adjust strategies accordingly, with many businesses finding that combining financial and operational metrics delivers comprehensive insights for strategic decision-making and competitive advantage.
A monthly target PowerPoint template enhances team accountability by establishing clear performance metrics, standardizing progress reporting, and creating visual transparency around individual and collective goals. Through consistent tracking frameworks, teams can identify performance gaps early, celebrate achievements publicly, and maintain focused discussions during reviews, ultimately fostering a culture of ownership and continuous improvement.
Incorporating interactivity in monthly target templates engages audiences through clickable charts, hover-over details, animated progress bars, dropdown filters, and interactive dashboards that allow real-time data exploration. These features transform static presentations into dynamic experiences, enabling stakeholders to drill down into specific metrics, compare performance across departments, and visualize progress pathways, ultimately delivering higher engagement and better decision-making outcomes.
Blue and green schemes work best for monthly target presentations, conveying trust, growth, and professionalism, while orange and red accents highlight urgent priorities and key metrics. These color combinations enhance readability across different viewing environments, from boardrooms to virtual meetings, with many organizations finding that consistent brand-aligned palettes ultimately deliver stronger visual impact and audience engagement.
Businesses can effectively communicate challenges and successes through structured monthly target presentations that include visual progress indicators, variance analysis, root cause explanations, and strategic action plans. These comprehensive overviews enable organizations to maintain transparency across departments, facilitate data-driven decision making, and align teams around corrective measures, with many companies finding that regular target reviews ultimately enhance accountability and accelerate goal achievement.
Infographics transform complex monthly target data into visually compelling, easily digestible formats that enhance comprehension, streamline decision-making, and facilitate faster stakeholder communication. Through strategic visual elements, charts, and color-coded progress indicators, organizations across retail, manufacturing, and financial services deliver clearer performance insights, ultimately enabling more effective team alignment and accelerated goal achievement.
Microsoft Excel integration, Power BI dashboards, project management platforms like Monday.com, automation tools such as Zapier, and data visualization software like Tableau can significantly enhance monthly target templates. These tools streamline data collection, automate progress tracking, and enable real-time updates, with many organizations finding that strategic integration ultimately delivers more accurate reporting and improved team accountability.
Organizations ensure editable monthly targets PowerPoint presentations by using standardized templates with consistent formatting, placeholder text, and modular slide structures that accommodate different metrics and timeframes. Through cloud-based platforms and version control systems, teams can seamlessly update data, customize visual elements, and maintain brand consistency, while establishing clear editing protocols ultimately delivers streamlined reporting processes and faster monthly planning cycles.
Data summarization techniques include visualization dashboards, key performance indicator (KPI) scorecards, trend analysis charts, comparative tables, and executive summary sections. These approaches streamline complex information by highlighting critical metrics, progress against targets, and variance analysis, with many organizations finding that visual storytelling through charts and infographics enables faster decision-making and clearer strategic insights.
User feedback improves monthly target PowerPoint templates by identifying usability issues, highlighting missing data visualization needs, and revealing preferences for specific chart types, color schemes, and layout configurations. Through regular feedback collection, organizations can enhance template clarity, streamline data input processes, and ensure presentations align with stakeholder expectations, ultimately delivering more effective reporting tools and improved decision-making outcomes.
Common pitfalls include overcomplicating visuals with excessive data, setting unrealistic targets without historical context, failing to align goals with broader company objectives, neglecting to include actionable next steps, and presenting information without clear ownership assignments. These presentation challenges can undermine team buy-in and goal achievement, with many organizations finding that streamlined, realistic target-setting approaches enhance accountability and drive better performance outcomes.
-
I am glad to have come across Slideteam. I was searching for some unique presentations and templates for my business. There are a lot of alternatives available here.
-
Content of slide is easy to understand and edit.