


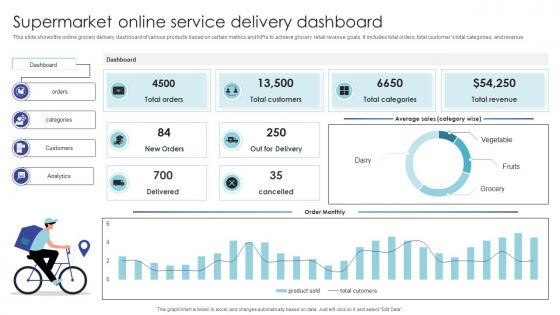
Supermarket Online Service Delivery Dashboard




Try Before you Buy Download Free Sample Product
 Impress Your
 Audience
 100%
100% Editable
 Save Hours
 of Time


This slide shows the online grocery delivery dashboard of various products based on certain metrics and KPIs to achieve grocery retail revenue goals. It includes total orders, total customers total categories, and revenue.
People who downloaded this PowerPoint presentation also viewed the following :
Supermarket Online Service Delivery Dashboard with all 7 slides:
Use our Supermarket Online Service Delivery Dashboard to effectively help you save your valuable time. They are readymade to fit into any presentation structure.





FAQs for Supermarket Online
Track your order fulfillment rate and delivery times first - that's your bread and butter. Customer satisfaction scores matter too, obviously. I'd also watch inventory availability and how often you're doing substitutions (people hate getting the wrong pasta sauce, trust me). Cart abandonment is massive since it shows exactly where you're bleeding customers. Real-time driver tracking is clutch - everyone wants to know when their ice cream's actually arriving. Don't forget delivery costs per order. Set up alerts when things dip so you can fix problems fast.
Honestly, real-time tracking is a game changer for keeping customers happy. People hate sitting there wondering if their groceries are actually coming or if the driver got lost somewhere. With live GPS updates, they can see exactly where their order is and when it'll actually show up. Plus you can shoot them a heads up about delays or if something's out of stock before they start getting annoyed. I swear, customers feel so much better when they have actual info instead of those vague "your order is being prepared" messages that go on forever. Build a decent tracking dashboard and they'll feel way more in control of the whole thing.
So user interaction analytics basically shows you where people actually click versus where you *think* they click. Heat maps are pretty wild - you can see exactly where users get stuck or what buttons they completely ignore. Like, if everyone's missing your "add to favorites" button, you know it needs to be way more obvious. The data reveals pain points you'd never spot just by guessing. Cart abandonment patterns become super clear too. Honestly, once you start tracking this stuff on your dashboard, you'll probably kick yourself for not doing it sooner. It's like having x-ray vision into customer behavior.
Track your average delivery times and on-time percentages first - that's your bread and butter. Set up alerts when delays hit whatever threshold makes sense for your business. Break everything down by zones, order sizes, and peak hours so you can spot the real problems. Heat maps showing geographic performance are actually pretty useful too. Honestly, the automated reporting saves tons of time once you get it running. Just make sure someone gets pinged automatically when things start going sideways, because manual checking is how stuff falls through the cracks.
Honestly, start with the real-time stock alerts + delivery route optimizer combo. Shows you exactly what's running low and how it's messing with your delivery rates. The inventory heat map is clutch too - gives you this visual breakdown of stock levels by category. During peak hours I'm basically glued to that dashboard lol. Connect the automated reorder stuff to your delivery metrics and you'll spot patterns like "we're always out of milk on Sundays and our ratings tank." Oh, and set up those threshold alerts right away. They'll hit you up before things get critical.
Set up quick feedback after deliveries - star ratings work great, maybe a comment box. Your dashboard should show this stuff right next to delivery stats like timing and accuracy. Most people only bother rating when they're pissed off or really happy, but honestly that's the feedback you need anyway. Watch for patterns - like if one store keeps getting complaints about bruised fruit or late orders. That'll show up fast. Oh, and definitely set alerts when ratings tank so you can jump on problems before they get worse.
Honestly, interactive dashboards are your best bet here - Tableau or Power BI work great since people love clicking around and exploring data themselves. Heat maps are clutch for showing delivery zones and busy periods (way more engaging than spreadsheets). I'd set up real-time scorecards for the basics like delivery times and customer satisfaction. Geographic views help a ton with route planning conversations too. Start simple though - give executives a quick overview that links to detailed breakdowns. That way the C-suite gets their snapshot while your ops team can dive deep when they need to troubleshoot stuff.
Check your dashboard for delivery time commitments first - nobody wants melted ice cream! Premium customers and time-sensitive stuff should be your top priority. Then batch deliveries by neighborhood so you're not zigzagging all over town like a maniac. Your real-time heatmap will show which areas are getting crushed with orders. Don't forget elderly customers and families with medical needs when you can swing it. Keep eyeing those delivery predictions though - you'll need to switch up routes constantly when new orders keep pouring in during rush.
Honestly, predictive analytics is a game-changer for inventory stuff. It forecasts demand using weather, seasons, local events - basically predicts what customers will want before they know it themselves. Your system automatically adjusts stock levels so you won't get stuck with leftover Halloween candy in November (been there). Plus it optimizes delivery routes by predicting order volumes per area. The trick is starting small though - focus on your top 20% products first. Way less overwhelming that way, and you'll see results faster.
So basically you get this central hub where drivers and warehouse people can all see what's happening in real time - order updates, delivery schedules, problems, whatever. There's instant messaging built in, plus status alerts and priority notifications. Way better than digging through a million random texts, honestly. When drivers hit delays or issues, they just report it straight through the system. Warehouse staff can immediately flag inventory problems or prep delays too. Everyone stays in the loop without the endless back-and-forth calls. Oh, and set up those automated pings so urgent stuff doesn't get missed.
Definitely need SSL encryption for all data transfers - that's like basic table stakes. Multi-factor authentication too. Payment stuff has to be PCI compliant or you're screwed with regulations. Role-based access is huge - your delivery drivers shouldn't see credit card info, just addresses and order details. Audit logs help track who's looking at what data. Oh and run security assessments regularly, can't just set it and forget it. The whole thing really comes down to showing each user only what they actually need to do their job. Less data exposure = less risk.
So basically you'd take all your delivery addresses and group them by location to create efficient routes. The system looks at customer addresses, traffic, and time windows to map out the best paths. Pretty cool how some dashboards even pull in live traffic data - saves drivers tons of time. Map interfaces work great because dispatchers can just drag orders around to tweak routes on the fly. I'd start simple with address geocoding and basic route optimization, then add the bells and whistles once that's working. Way easier to build on something solid than try to do everything at once.
Your dashboard's gonna get slammed during seasonal spikes - Black Friday madness, Christmas grocery runs where everyone suddenly needs turkeys. Build in dynamic capacity planning and forecasting that can handle these crazy shifts. Flexible slot allocation is key so you can prioritize high-demand stuff when things get nuts. The interface should show seasonal insights to prep your ops team. Oh, and definitely add automated alerts for weird demand patterns - trust me, you don't want to be blindsided when pumpkin spice everything takes over again!
Throw in some competitor benchmarking panels - delivery times, satisfaction scores, order accuracy, that kind of stuff. Side-by-side bar charts work great, or those gauge things that show if you're crushing it or falling behind. The gauges actually look pretty cool in exec meetings, not gonna lie. Just make sure you're comparing the same stuff - like same regions, similar order types. Otherwise the data's kinda useless. I'd update competitor info monthly and call out your biggest problem areas so everyone knows what needs fixing first.
Put your key stuff like order volume and delivery times right up front - that's what people actually need to see. Red for problems, green for good - basic but it works. I've seen way too many dashboards that are just a mess of random widgets everywhere. Staff using this during rush periods don't have time to hunt around, so make your main filters super easy to find. Mobile's huge since managers are always checking numbers on their phones between meetings or whatever. Oh, and definitely test it with real store people first - they'll catch stuff you'd never think of.
-
SlideTeam, Please don’t stop sharing discount coupons! I love your occasional discounts and tend to buy your products around that corner.
-
Easy to use and customize templates. Helped me give a last minute presentation.