

Présentation PowerPoint sur l'analyse des processus




Try Before you Buy Download Free Sample Product
 Impress Your
Audience
 100%
Editable
 Save Hours
of Time


Minimisez les réalisations avec nos diapositives de présentation PowerPoint d'analyse de processus. Ne vous laissez pas emporter par les applaudissements.
People who downloaded this PowerPoint presentation also viewed the following :
Contenu de cette présentation Powerpoint
Diapositive 1 : Cette diapositive présente l'analyse des processus. Indiquez le nom de votre entreprise et commencez.
Diapositive 2 : Cette diapositive présente la méthodologie des processus qui comprend : Analyse, Conception, Exécution, Modélisation, Optimisation, Surveillance, Processus métier, Méthodologie.
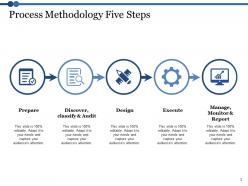
Diapositive 3 : Cette diapositive présente les cinq étapes de la méthodologie des processus qui comprennent : Préparer, Découvrir, classer et auditer, Concevoir, Exécuter, Gérer, surveiller et rapporter.
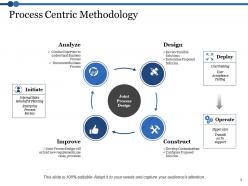
Diapositive 4 : Cette diapositive présente la méthodologie centrée sur les processus qui comprend : Conception, Analyse, Amélioration, Conception.
Diapositive 5 : Cette diapositive présente la méthodologie des processus en six étapes qui comprend : Processus Scrum, Construire l'incrément de produit, Revue de sprint, Rétrospective de sprint, Mettre à jour le backlog de produit, Réunions quotidiennes, Incrément de produit potentiellement livrable, Réunion de planification de sprint.
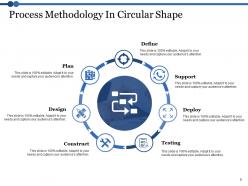
Diapositive 6 : Cette diapositive présente la méthodologie des processus sous forme circulaire avec les étapes suivantes : Support, Déploiement, Tests, Construction, Conception, Planification, Définition.
Diapositive 7 : Cette diapositive est intitulée Diapositives supplémentaires pour aller de l'avant.
Diapositive 8 : C'est une diapositive sur la vision, la mission et les objectifs. Énoncez-les ici.
Diapositive 9 : C'est une diapositive sur notre équipe avec des zones de texte pour le nom, l'image et les informations.
Diapositive 10 : C'est une diapositive de présentation de notre entreprise, de la valeur client et des services premium.
Diapositive 11 : C'est une diapositive sur nos objectifs. Énoncez-les ici.
Diapositive 12 : Cette diapositive compare les facteurs positifs et négatifs avec des images de pouce levé et pouce baissé.
Diapositive 13 : Cette diapositive présente une carte heuristique pour représenter les entités.
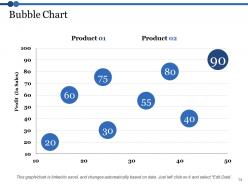
Diapositive 14 : Cette diapositive présente un graphique à bulles.
Diapositive 15 : Cette diapositive présente un graphique boursier.
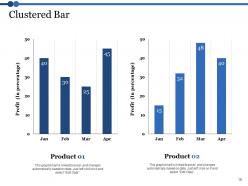
Diapositive 16 : Cette diapositive présente un graphique à barres clustered.
Diapositive 17 : Cette diapositive présente l'adresse. Merci d'avoir regardé !
1. Introduction au processus d'analyse 2. Définition de l'analyse de processus 3. Objectifs de l'analyse de processus 4. Étapes de l'analyse de processus 5. Collecte des données 6. Cartographie du processus 7. Analyse des goulots d'étranglement 8. Identification des opportunités d'amélioration 9. Développement de solutions 10. Mise en œuvre des changements 11. Suivi et évaluation 12. Avantages de l'analyse de processus 13. Études de cas réussies 14. Défis et obstacles courants 15. Meilleures pratiques 16. Ressources et outils 17. Conclusion
Prenez une longueur d'avance avec nos diapositives de présentation PowerPoint d'analyse de processus. Vous serez le premier parmi les égaux.











FAQs for Process Analysis
You want three things: be clear, cover everything, and put stuff in order. Break it down step-by-step so anyone could follow along without scratching their head. Each step needs a point - none of that "and then something magical happens" nonsense (seriously, who writes docs like that?). Figure out what goes in, what comes out, where decisions get made, and who does what. List your tools and what you need beforehand. Here's the thing though - you'll think it's perfect until someone else tries it. Have a coworker walk through it. When they get lost, that's where you fix things.
Look, process analysis is honestly a game-changer for spotting where you're bleeding time and money. Map out your workflows and you'll literally see the bottlenecks and redundancies - it's crazy how much waste becomes obvious once it's visual. Talk to the people actually doing the work, not just their bosses (they know where the real pain points are). Start with whatever process drives everyone nuts or takes forever. You can usually automate chunks of it or cut out pointless handoffs. My old job had like 7 approval steps for ordering supplies - ridiculous. Quick wins here make a huge difference.
Look, data collection is where everything starts - skip it and you're basically flying blind. Grab both the hard numbers (cycle times, error rates, costs) and the softer stuff like what employees actually think is broken. Too many teams I've worked with just assume they know the problem and jump straight to fixing it. Big mistake. You've gotta look at multiple points in your process, not just the obvious jams. Map what data you already have first, then figure out what's missing. It's honestly the difference between actually solving something vs. just making changes that feel productive.
First thing - map out your whole process and time each step. Seriously, follow the actual work around, don't just rely on what you think happens on paper. Queue buildups are usually dead giveaways for bottlenecks. Check who's constantly slammed while others have downtime - that's your constraint right there. Calculate throughput rates to find the slowest points. Oh, and track this stuff for at least a week because patterns take time to show up. One measurement won't tell you much.
Flowcharts are your bread and butter for showing the basic sequence. Value stream maps? Total lifesaver for spotting waste and bottlenecks - seriously changed how I approach process analysis. Swimlane diagrams work great when you need to show who does what (prevents the usual "that's not my job" drama). Heat maps are solid for clustering problem areas. Oh, and before/after comparisons really drive the point home with stakeholders. Pick what fits your audience though. Execs want those high-level value streams, but your team needs detailed flowcharts they'll actually reference later.
Process mapping is like having a visual translator for all your stakeholder chaos. Instead of those painful email threads where nobody gets it, you just show people a map of how things actually work. They can see their role, what happens if they're late, where the bottlenecks are - the whole picture clicks. Honestly, I've sat through way too many meetings where people talk in circles about processes. But throw up a process map? Suddenly everyone's engaged and asking good questions. You'll get buy-in faster because people aren't confused anymore. Game changer for meetings.
Honestly, just pick like 2-3 metrics that actually matter instead of drowning in data. Cycle time's obvious - how long stuff takes start to finish. Quality stuff like error rates, because yeah, being fast but terrible is pointless. Cost per unit tells you if you're being efficient or burning money. Oh, and throughput - basically how much volume you can actually push through without everything falling apart. My advice? Start with whatever's driving you crazy right now. If customers are complaining about speed, track cycle time first. Don't overthink it.
Honestly, process analysis is like getting X-ray vision for your business operations. It shows you bottlenecks and waste that you'd never catch just by watching the daily grind. The cool part? You get actual baseline data, so when you make changes, you'll know if they're genuinely helping or just shuffling problems around. Plus you're hitting root causes instead of slapping band-aids on symptoms. I'd say pick one workflow that's been driving your team nuts and map it out first - though fair warning, you might discover the inefficiencies run deeper than expected. The insights usually surprise people.
So tech integration cuts out all that human error stuff and gives you data as it's happening - no more waiting around for reports or guessing what's going on. Process mining software tracks everything automatically, IoT sensors grab the real numbers, and AI spots weird patterns you'd totally miss. We used to think we had everything figured out with our Excel sheets, but wow were we wrong! The automated collection means no more biased observations clouding things up. Just pick one process to start with and throw some basic tracking on it. You'll be shocked at how different reality is from what you assumed was happening.
Don't analyze processes without actually talking to the people doing the work - you'll miss tons of critical stuff. Also, skip the procedure manuals and shadow someone instead. Those official docs are usually garbage compared to what really happens. Try not to get bogged down documenting every little detail or you'll go insane. Short sentences work too. And here's the thing that trips everyone up - don't start redesigning while you're still figuring out the current mess. I made that mistake before and it was a nightmare. Finish mapping first, then fix later.
Dude, you absolutely have to get employees involved from day one. The people doing the actual work know where things break down - management usually has no clue what's really happening on the ground. I've watched so many consultants completely whiff because they skipped talking to frontline staff. Honestly, it's kind of embarrassing when it happens. Your team will catch inefficiencies that outsiders walk right past. Plus there's this bonus effect where people actually want to fix problems they helped identify. Makes sense, right? Don't even start mapping anything until you've sat down with the folks doing the work.
Honestly, visual documentation is everything here. Map out the current process with diagrams and flowcharts - way better than walls of text that nobody reads. Document your findings with actual numbers and specific pain points. Screenshots are clutch too. Don't just note what's broken; figure out why it's broken in the first place. Your recommendations need priority levels so people know what to tackle first. Oh, and that executive summary? Make it one page max. Store everything somewhere everyone can access with version control. Future you will be so grateful you stayed organized instead of just dumping everything in random folders.
Process analysis is honestly a game-changer for this stuff. Map out your whole customer journey first - every single touchpoint from when they first hear about you to support calls later. Then hunt for the weird bottlenecks and confusing steps that make people bounce. I remember reading about this company that was hemorrhaging customers at checkout because their form had like 20 fields or something ridiculous. Once you find those pain points, start chopping out the unnecessary steps and fixing what's broken. Just make sure you're measuring before and after - otherwise you'll never know if you actually improved anything.
Honestly, the "we've always done it this way" crowd will drive you insane. People absolutely hate changing their routines, even with rock-solid data backing you up. Leadership always lowballs the resources too - they think improvements happen overnight with zero budget. Communication breakdowns are huge. Oh, and if your change management sucks, you're toast. I'd start with small pilot programs first. Gets people bought in without freaking everyone out. Also, definitely loop in the actual workers early on - they know stuff analysts miss sitting at their desks all day.
Manufacturing is way easier to analyze since you can literally see everything - materials moving around, machines running, quality checks happening. You know exactly what's going on. Service industries though? Total nightmare honestly. You're trying to map out customer conversations and all these invisible decision points that happen in people's heads. Plus manufacturing processes are pretty predictable most of the time. Services depend on whoever's working that day and what mood the customer's in. My advice? Just focus on whatever your industry actually produces when you're figuring out how to analyze things.
No Reviews