


Profit And Loss Account Statement Summary Hair Salon Business Plan BP SS




Try Before you Buy Download Free Sample Product
 Impress Your
 Audience
 100%
100% Editable
 Save Hours
 of Time


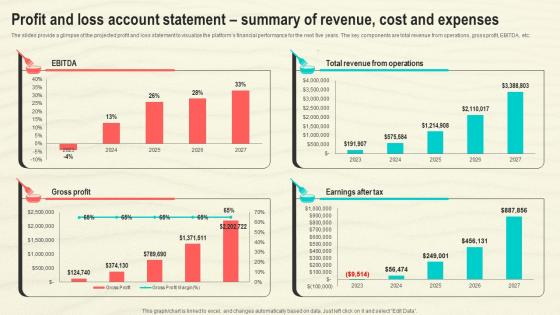
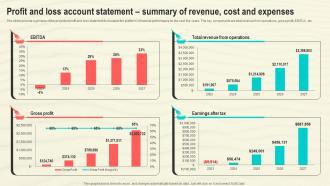
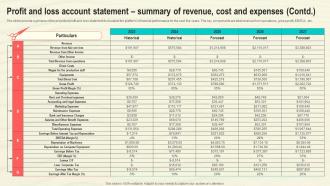
The slides provide a glimpse of the projected profit and loss statement to visualize the platforms financial performance for the next five years. The key components are total revenue from operations, gross profit, EBITDA, etc.
People who downloaded this PowerPoint presentation also viewed the following :
Profit And Loss Account Statement Summary Hair Salon Business Plan BP SS with all 10 slides:
Use our Profit And Loss Account Statement Summary Hair Salon Business Plan BP SS to effectively help you save your valuable time. They are readymade to fit into any presentation structure.








FAQs for Profit And Loss Account Statement Summary Hair Salon Business
The primary purpose of a profit and loss account is to measure a company's financial performance over a specific period by tracking revenues, expenses, and net income or loss. This essential financial statement enables stakeholders, investors, and management to assess profitability trends, operational efficiency, and business viability, ultimately delivering critical insights for strategic decision-making and resource allocation.
A profit and loss account tracks revenue, expenses, and net income over a specific period, while a balance sheet provides a snapshot of assets, liabilities, and equity at a particular date. These complementary financial statements enable businesses to assess operational performance and financial position simultaneously, with many organizations finding that together they deliver comprehensive insights for strategic decision-making and investor transparency.
A profit and loss account typically includes revenue, cost of goods sold, gross profit, operating expenses, operating profit, interest expenses, taxes, and net profit. These components enable businesses to assess financial performance comprehensively, with many organizations finding that detailed P&L analysis streamlines budgeting, enhances strategic decision-making, and ultimately delivers improved operational efficiency and competitive advantage.
Small businesses can leverage their profit and loss accounts for strategic decision-making by analyzing revenue trends, identifying cost reduction opportunities, evaluating product profitability, and monitoring cash flow patterns. Through regular P&L reviews, businesses streamline operations, optimize pricing strategies, and allocate resources more effectively, with many finding that monthly analysis enables faster pivots and ultimately delivers improved profitability and competitive advantage.
Net profit serves as a fundamental indicator of financial health by measuring a company's ability to generate earnings after all expenses, reflecting operational efficiency, cost management effectiveness, and overall business sustainability. It enables investors, creditors, and stakeholders to assess profitability trends, compare performance against competitors, and evaluate management's strategic decisions, with many financial institutions and analysts using net profit margins to determine creditworthiness and investment potential.
Operating expenses directly reduce profitability by decreasing net income, as they include costs like salaries, rent, utilities, marketing, and administrative expenses that must be subtracted from revenue. While higher operating expenses can indicate business growth and investment in capabilities, companies increasingly focus on optimizing these costs through automation and efficiency measures, with many organizations finding that strategic expense management delivers improved margins and competitive advantage.
Gross profit margin reveals a company's core operational efficiency by measuring revenue remaining after direct production costs, indicating pricing power, cost control effectiveness, and competitive positioning. This key metric enables businesses to benchmark performance against industry standards, identify operational improvements, and make strategic decisions about product mix and pricing strategies, ultimately delivering insights that drive profitability optimization and sustainable growth.
Variance analysis using profit and loss accounts compares actual financial performance against budgeted figures, examining revenue variances, cost variances, and margin deviations across different business segments. Through systematic comparison of planned versus actual results, organizations identify operational inefficiencies, pricing discrepancies, and cost overruns, ultimately enabling strategic adjustments that enhance profitability and competitive positioning.
Seasonal businesses can analyze profit and loss accounts by comparing monthly revenue patterns, identifying peak and off-season expense ratios, tracking cash flow cycles, and calculating seasonal margin variations. These analyses enable retailers, tourism operators, and agricultural businesses to optimize inventory timing, adjust staffing levels strategically, and build financial reserves during peak periods, ultimately delivering improved cash management and more accurate revenue forecasting.
Common mistakes include misclassifying expenses as assets, omitting accrued revenues or expenses, incorrectly timing revenue recognition, and failing to separate operating from non-operating items. These errors can mislead stakeholders about true profitability, with many financial teams finding that standardized templates and regular reconciliation processes streamline accuracy and enhance reporting credibility.
Businesses should review profit and loss accounts monthly for operational insights and quarterly for strategic planning, with annual comprehensive analysis for long-term decision making. Regular monitoring enables organizations to identify trends, adjust budgets, and respond to market changes quickly, while monthly reviews help streamline cash flow management and enhance financial forecasting accuracy.
Software tools for profit and loss accounts include QuickBooks, Xero, SAP, Oracle Financial, FreshBooks, and Sage, along with specialized analytics platforms like Tableau and Power BI. These solutions streamline financial reporting by automating data collection, generating real-time insights, and enabling comprehensive variance analysis, with many organizations finding that integrated accounting software significantly reduces manual processing time while enhancing accuracy and strategic decision-making capabilities.
A profit and loss account demonstrates financial performance, revenue trends, profitability margins, and operational efficiency to potential investors and lenders. This comprehensive financial snapshot enables stakeholders to assess business viability, growth potential, and risk factors, with banks and venture capitalists finding that consistent profit patterns significantly enhance funding approval rates and investment attractiveness.
Tax implications in profit and loss accounts include corporate income tax expenses, deferred tax liabilities, tax credits, withholding taxes, and provisions for uncertain tax positions. These components directly impact net income calculations and cash flow planning, with many organizations finding that strategic tax management through proper P&L reporting enhances operational efficiency and regulatory compliance.
International accounting standards like IFRS and GAAP significantly influence profit and loss preparation by standardizing revenue recognition, expense classification, depreciation methods, and financial reporting frameworks across jurisdictions. These standards enhance comparability and transparency for multinational corporations, banks, and investment firms, while ensuring consistent presentation of operating results, ultimately delivering improved investor confidence and streamlined cross-border business operations.
-
Use of icon with content is very relateable, informative and appealing.
-
The designs are very attractive and easy to edit. Looking forward to downloading more of your PowerPoint Presentations.