

Projected Profit And Loss Account Statement For Transportation And Logistics Business Plan BP SS




Try Before you Buy Download Free Sample Product
 Impress Your
 Audience
 100%
100% Editable
 Save Hours
 of Time


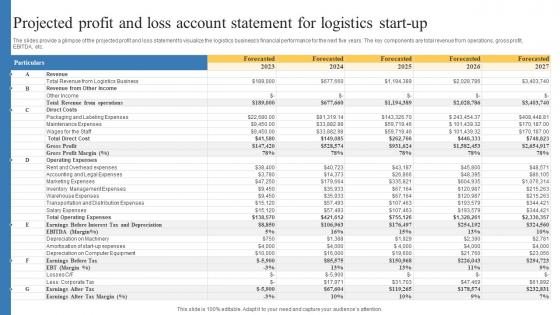
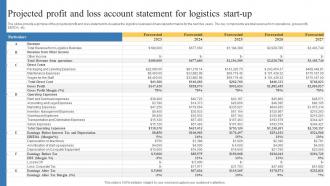
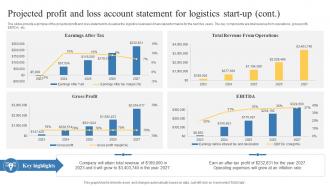
The slides provide a glimpse of the projected profit and loss statement to visualize the logistics businesss financial performance for the next five years. The key components are total revenue from operations, gross profit,EBITDA, etc.
People who downloaded this PowerPoint presentation also viewed the following :
Projected Profit And Loss Account Statement For Transportation And Logistics Business Plan BP SS with all 10 slides:
Use our Projected Profit And Loss Account Statement For Transportation And Logistics Business Plan BP SS to effectively help you save your valuable time. They are readymade to fit into any presentation structure.








FAQs for Projected Profit And Loss Account Statement For Transportation And Logistics Business
Start with your revenue at the top, then subtract cost of goods sold - that gives you gross profit. Next comes all your operating expenses: rent, salaries, marketing, utilities, whatever it costs to keep the doors open. Oh and don't forget depreciation if you've got equipment or anything. After that, add in interest income/expenses and taxes. The final number is your projected profit or loss. Honestly, I'd do it month by month for year one. Way easier to catch seasonal patterns and avoid those nasty cash flow surprises that always seem to pop up at the worst times.
Look, your sales growth assumptions are going to drive literally everything in your P&L. Revenue goes up, sure, but so do your variable costs - materials, commissions, all that stuff. Fixed costs don't budge though, which is actually where the magic happens for margins. Here's the thing - if you're way too optimistic, you'll think you're making bank when you're not. Too pessimistic? You might pass up good opportunities or not invest enough in growing capacity. Honestly, just run three scenarios: conservative, realistic, and optimistic. You'll quickly see how much your projections swing based on different growth rates. It's kind of eye-opening.
So from your projected P&L, you'll want to grab the main profitability ratios - gross margin, net margin, operating margin. These show how well you're converting sales to actual profit. EBITDA's another good one, investors eat that up. Break-even analysis is clutch too. Honestly, the real value isn't just having the numbers though. Use them to catch cash flow problems before they bite you in the ass, and pivot your strategy when needed. ROI projections help with that too - gives you a heads up on what's actually working.
Monthly updates are where it's at - quarterly feels too slow to catch problems before they spiral. Fast-growing companies sometimes do weekly updates, which honestly sounds exhausting but I get it when everything's moving fast. The real trick is just being consistent with whatever timeline you pick. Set up a recurring reminder and actually stick to it (easier said than done, I know). Trust me though, you'll be so glad you did this when you're scrambling to put together budgets later. Even catching one trend early makes the whole exercise worth it.
Look, market analysis is your sanity check before building those P&L projections. You don't want your numbers based on pure fantasy, right? Dig into competitor pricing, market size, and how customers actually behave. Growth rates matter too - I learned this the hard way on my last project. Without this groundwork, you're just guessing at market share and probably being way too optimistic. Plus it'll help you catch threats or new opportunities that mess with your costs. Start with 3-5 direct competitors and grab some industry reports first. Then hit the spreadsheets.
Dude, P&L projections are literally a lifesaver for startups. They'll show you exactly when cash gets tight so you're not scrambling last minute. Plus you can see if your revenue goals are actually realistic or just wishful thinking. Makes hiring decisions way easier too - like, do we actually have budget for that developer next quarter? Investors eat this stuff up btw. Shows you're not just winging it with some half-baked idea. I always tell people start conservative with the numbers. Way better to overdeliver than promise the moon and crash. Update monthly once real data starts rolling in.
Dude, the classic trap is being way too optimistic with your sales projections. Linear growth sounds nice on paper but real business is messier than that. Factor in seasonality and how long deals actually take to close - it's always longer than you think. Competition exists too, so don't assume you'll magically grab 20% market share right away. I learned this the hard way with my last startup, honestly. Build three scenarios: conservative, realistic, and optimistic. Use historical data if you've got it. New products almost never hit revenue targets immediately, so give yourself buffer time there too.
Oh man, seasonal swings will totally wreck your P&L if you don't plan for them. Think about it - retail stores are absolutely killing it in December but then January hits and it's crickets. Ice cream places basically shut down half the year (honestly, who wants a cone when it's snowing?). Don't just take your annual numbers and divide by 12 - that's a rookie move. You gotta dig into at least 2-3 years of old data to see the real patterns. Then build those ups and downs into each month's projections. Your cash flow will actually make sense instead of being this confusing mess.
Dude, so many good options here. Excel and Google Sheets are still clutch - everyone already knows them and they're super flexible. QuickBooks, Xero, and FreshBooks have forecasting built right in, which is nice since they pull your real data. Want something fancier? Adaptive Insights and Anaplan are solid for scenario planning. I've honestly seen people crush it with just basic spreadsheets though. The main thing is picking whatever you'll actually stick with and can update easily when things change. Oh, and Cube's pretty cool too if you're into that sort of thing. Start simple first.
So direct costs are pretty straightforward - materials, labor, shipping - they hit your bottom line right away since they're tied to each thing you sell. The tricky stuff is indirect costs like rent and utilities. You've got to spread those fixed expenses across however many units you think you'll sell, which honestly gets messy if your sales projections are wrong. I'd tackle the direct costs first since those are way more predictable. Then be conservative when you're dividing up the overhead costs - better to overestimate than get caught short later.
Look, margins of error are basically admitting you don't have a crystal ball - which is smart. I usually go with 10-20% because honestly, when has anything ever gone exactly to plan? Your projections will be wrong, so build in that cushion upfront. It protects you from overcommitting money or resources when reality hits different than expected. Stakeholders actually trust you more when you're realistic about uncertainty rather than pretending everything's guaranteed. Use those adjusted numbers for your actual budgets, not the perfect-world version. Way better to underpromise and overdeliver than get caught scrambling when things don't match your rosy forecasts.
Dude, comparative analysis is a game-changer for your P&L projections. It gives your numbers actual context instead of looking like random guesses. You'll want to pull at least 3 years of historical data and industry benchmarks - trust me on this one. Compare against competitors, your own past performance, whatever you can find. This stuff catches those crazy unrealistic assumptions before you present to investors and look like an idiot. Plus it helps spot actual trends and seasonal patterns. Way better than just hoping your growth projections sound reasonable. I learned this the hard way last year.
Start with your last 2-3 years of sales data - that's your foundation. Break it down by customer types or product lines instead of one massive guess. Way more accurate, trust me. Don't count every lead in your pipeline as guaranteed money (learned that the hard way). I'd try a few different forecasting methods - bottom-up sales projections, market analysis, whatever works - then see how they compare. The real trick? Update monthly as new info comes in. Most people set it once then never touch it again, which is pretty useless.
Higher operational expenses hit your profits dollar-for-dollar. Pretty straightforward math there. Rent goes up $500? That's $500 less profit. Same with salaries, utilities, whatever. Now, some expenses might actually bring in more revenue - like if you hire extra salespeople who crush it. But let's be real, most cost increases just shrink your margins. I'd definitely run a few different scenarios when you're doing your P&L projections. That way you can see best case, worst case, and figure out what you're actually dealing with.
Honestly, a projected P&L shows you're not just making up numbers on the fly. Investors want to see you actually understand your revenue streams and costs. Lenders are even pickier - they'll dig into every expense line to make sure you know where money's going. The whole process forces you to think through worst-case scenarios before you're in that meeting. (Which is way better than getting blindsided by obvious questions.) My biggest tip? Don't get overly optimistic with your projections. Be ready to explain why you picked every single number, because they'll definitely ask.
-
I joined SlideTeam last month and there’s no doubt that I tend to find our bond only strengthening over time. Best place to find world-class themes, templates, and icons.
-
A fantastic collection of templates. I'll likely use this as my go-to resource for future templates and support.