


Projected Profit And Loss Account Statement For Skincare Start Up Business Plan BP SS




Try Before you Buy Download Free Sample Product
 Impress Your
 Audience
 100%
100% Editable
 Save Hours
 of Time


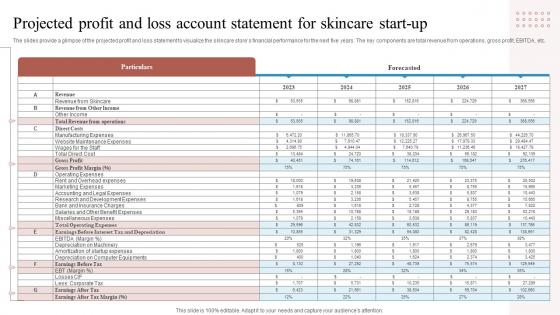
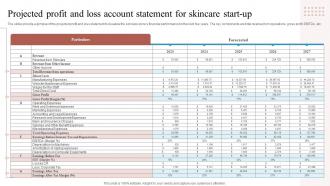
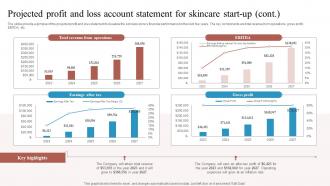
The slides provide a glimpse of the projected profit and loss statement to visualize the skincare stores financial performance for the next five years. The key components are total revenue from operations, gross profit, EBITDA, etc.
People who downloaded this PowerPoint presentation also viewed the following :
Projected Profit And Loss Account Statement For Skincare Start Up Business Plan BP SS with all 11 slides:
Use our Projected Profit And Loss Account Statement For Skincare Start Up Business Plan BP SS to effectively help you save your valuable time. They are readymade to fit into any presentation structure.








FAQs for Projected Profit And Loss Account Statement For Skincare Start Up Business
Okay so you'll want to start with your revenue - basically all the money you expect coming in. Then figure out cost of goods sold to get your gross profit. Operating expenses are next (rent, salaries, marketing, all that fun stuff). Subtract those from gross profit and boom - operating income. Oh, and don't space on interest, taxes, and depreciation because those will bite you later. That gets you to net income, which is what you actually made or lost. I'd honestly be conservative with revenue projections though. Better to lowball it than look like an idiot when you miss by miles.
Look at your actual sales history first - that's way more reliable than guessing. Factor in seasonal stuff, marketing pushes, any new products you're launching. Honestly, most people are terrible at this because they get too optimistic. Build three versions: conservative, realistic, and the "everything goes perfect" scenario. Check your pipeline and conversion rates to get monthly numbers that make sense. Your crystal ball sucks (mine does too), but at least you'll have a range. Update everything quarterly when real numbers come in - that's the only way to get better at it.
Look, spell out everything upfront - revenue growth, pricing changes, cost bumps, market shifts you're seeing. Put it all in its own section because investors will grill you on this stuff anyway. Customer acquisition rates, seasonal patterns, new product launches too. Oh and don't forget the boring operational things like hiring plans or equipment purchases (honestly those details matter more than people think). The more you show your work, the less sketchy your projections seem. Just throw together a simple assumptions sheet as an appendix - keeps everything clean.
Monthly updates are your sweet spot, but quarterly works if that's all you can manage. Catching trends early beats scrambling later when everything's gone sideways. I know way too many founders who build these gorgeous spreadsheets in January then literally never look at them again - such a waste. Fast-growing or seasonal businesses? Maybe check bi-weekly. The whole point is comparing what actually happened vs what you thought would happen. Otherwise you're just flying blind. Oh, and set that calendar reminder right now or you'll definitely forget.
Look, historical data is what keeps you from totally winging your projections. Pull your P&Ls from the last 2-3 years and hunt for patterns - like when sales usually dip or which months your costs go crazy. You'll see the real rhythm of your business instead of just guessing. Honestly, those seasonal trends are probably way more predictable than you think. Watch for the weird outliers too, because you don't want to accidentally bake a one-time expense into next year's budget. It's way better than crossing your fingers and hoping for the best.
Honestly, benchmarks are a lifesaver for P&L stuff - way better than pulling numbers out of thin air. Look at what similar companies are doing with gross margins, expenses, growth rates. If everyone else spends 15% on marketing and you're projecting 5%, that's probably unrealistic. I usually grab data from 2-3 industry reports (trade associations are good for this) and use those ranges to check my work. Short sentences help too. The expense ratios are where I catch most of my mistakes - it's wild how off you can be without that reality check.
Honestly, most people get way too excited about how much money they'll make and completely ignore seasonal dips. Operating expenses always bite you in the ass - all those random costs like equipment breaking down or having to replace staff. Also, just because you made a sale doesn't mean the cash is in your account yet. That timing gap kills businesses. Oh and build in extra money for random crap that will definitely go wrong. I always tell people to run their numbers through a couple different scenarios. Better to be pleasantly surprised than totally screwed.
Dude, seasonal swings will mess with your P&L big time. Revenue shoots up during busy months, then tanks when things get quiet - and that hits your profit margins hard. Fixed costs like rent don't budge, but you're still dropping cash on extra inventory before the rush hits. Build these patterns into your projections upfront so you can actually plan your cash flow. Otherwise you'll get blindsided when the slow season rolls around. Trust me, I've seen too many businesses scramble because they didn't see it coming. The planning part is honestly tedious but it'll save your butt later.
Look, investors want to see you've actually thought this through instead of just throwing darts at a board. Your P&L shows them the real deal - how you'll make money, what it'll cost, when you'll turn a profit. They need those numbers to figure out if your business makes sense for their portfolio. It also proves you're not one of those founders who thinks "if we build it, they will come" (spoiler alert: they won't). Just don't go crazy with the projections though. I've seen too many people get grilled because their numbers were way too rosy.
Build 3-4 different P&L versions with varying assumptions - conservative, realistic, optimistic. Change one thing at a time (sales targets, marketing budget, new products) so you can actually see what's making the difference. I'm obsessed with side-by-side comparisons because they show you which moves will boost profits vs just burn cash. It's like testing your ideas without the expensive mistakes. Plus you'll catch cash flow problems way earlier than if you just wing it. Honestly, the "what-if" game has saved me from some pretty dumb decisions over the years.
So fixed costs don't budge no matter what - rent, insurance, your full-time people's salaries. Variable costs move up and down with how busy you are. Think materials, shipping, commissions. But here's where it gets annoying: some costs are mixed, part fixed and part variable. Honestly, most people mess this up when they're doing projections. Getting it right though? Game changer for your break-even math. Just go through your expense list and ask yourself "would this cost more if I doubled my sales?" That'll help you figure out what you can actually control.
Dude, just get QuickBooks or something like LivePlan - they'll pull your old financial data and basically do the math for you. No more fighting with Excel spreadsheets (thank god). You can tweak different scenarios in real-time, which is honestly pretty cool when you're trying to figure out what happens if sales drop or whatever. The software connects to your other financial stuff too, so it's all synced up. I'd say start simple though - don't go crazy with some complex system right away. Let the tool handle the number crunching while you focus on the bigger picture assumptions.
Just cut to the chase and lead with your bottom line - that's literally all they want to hear first. Then walk backwards through your assumptions: growth rates, big expenses, timeline stuff. Charts beat spreadsheet dumps every time, trust me on this. Call out any seasonal weirdness or big shifts coming up. The thing that'll make or break you though? Having real data behind your numbers, not just "we think this'll happen" nonsense. Always bring three scenarios - conservative, realistic, optimistic. Oh and don't forget to actually ask for what you need at the end.
Think of your projected P&L as your financial GPS - shows where money's flowing in and out so you can actually plan ahead. I update mine quarterly (sometimes more if things get crazy). It helps you catch cash problems early and figure out if you can afford that new hire or market expansion. Honestly, it's way better than just winging it and hoping for the best. You'll spot patterns in your spending and see which revenue streams are actually worth focusing on. Makes those budget meetings so much easier when you've got real numbers to work with instead of just guessing.
So definitely include a cash flow statement and balance sheet with your P&L. Those three together show the whole picture. Cash flow is huge - profit on paper doesn't mean you actually have money sitting there (trust me on this one). Also add a doc explaining your assumptions for how you got those revenue numbers. Break-even analysis is good if you're pitching to investors or banks. Oh and double-check that all your numbers match up across the documents because people always compare them side by side.
-
Excellent products for quick understanding.
-
SlideTeam was so customer-centric and quick service-provider that I doubted the amount I was paying and literally re-checked the transaction.
-
Easy to use and customize templates. Helped me give a last minute presentation.
-
I joined SlideTeam last month and there’s no doubt that I tend to find our bond only strengthening over time. Best place to find world-class themes, templates, and icons.