


Project Report For Bank Loan 5 Years Projected Balance Sheet Ppt Slides Background Image




Try Before you Buy Download Free Sample Product
 Impress Your
 Audience
 100%
100% Editable
 Save Hours
 of Time


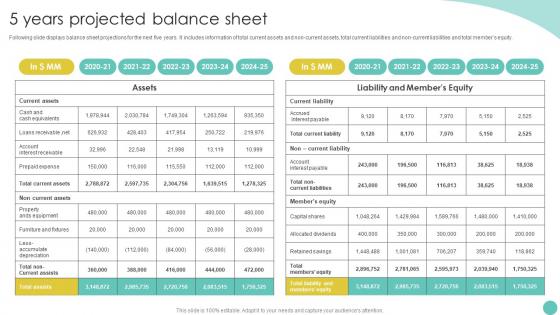
Following slide displays balance sheet projections for the next five years. It includes information of total current assets and non current assets, total current liabilities and non current liabilities and total members equity.
People who downloaded this PowerPoint presentation also viewed the following :
Project Report For Bank Loan 5 Years Projected Balance Sheet Ppt Slides Background Image with all 6 slides:
Use our Project Report For Bank Loan 5 Years Projected Balance Sheet Ppt Slides Background Image to effectively help you save your valuable time. They are readymade to fit into any presentation structure.





FAQs for Project Report For Bank Loan 5 Years Projected Balance Sheet Ppt
So it's basically the same stuff as a regular balance sheet - assets, liabilities, equity - just for future dates. You'll need to forecast cash, receivables, inventory, fixed assets on one side. Then payables, debt, accrued expenses on the other. Equity gets tricky because you're adding projected earnings to retained earnings. Honestly? The hardest part is making everything actually balance - I always mess that up the first time. Start with your revenue forecasts and work backward from there. And don't get too optimistic with your assumptions or you'll just be lying to yourself later.
Projected balance sheets are like having a crystal ball for your startup's finances. They show what your money situation will look like months ahead. Super helpful for spotting when you might run low on cash or need more funding. Most founders sleep on these at first, but honestly they're game-changers for big decisions - hiring, buying equipment, pitching investors. Even rough quarterly projections save you from getting blindsided later. I learned this the hard way lol. They prove to investors that you actually understand your numbers and aren't just winging it financially.
You're gonna need solid assumptions about revenue growth and expenses first - those drive everything else. Cash flow timing is honestly the trickiest part since it affects your whole model. I'd map out depreciation schedules, debt payments, and any big purchases you're planning. Seasonal stuff matters too if that applies to your business. Collection periods and inventory turnover can make or break your projections, so think through different scenarios there. Oh, and write down all your assumptions somewhere - trust me, you'll want to tweak them later when reality hits differently than expected.
Your balance sheet is only as good as your cash flow projections, honestly. Get those wrong and everything else falls apart. Like if you're too optimistic about collections, you'll show way too much cash and your receivables will look weird. Same thing with capex - lowball those estimates and your fixed assets won't match reality. I learned this the hard way last quarter, actually. Everything's connected, so being conservative with your assumptions saves you headaches later. Just update them regularly when you get new data and you'll be fine.
Most people do 3-5 years for projected balance sheets. You'll see some 1-year ones too for short-term stuff. Really depends what you need it for though - investor pitch or big strategy stuff? Go longer. Just operational budgeting? Keep it shorter. Honestly anything past 5 years is kinda BS anyway since you're basically guessing at that point. I'd match your timeline to how predictable your business actually is. Some industries are way more stable than others, you know? Start with what feels doable and tweak it later if needed.
Quarterly is the bare minimum, but monthly is so much better if you can manage it. Things change crazy fast - expenses you didn't see coming, revenue swings, that big purchase moving up a quarter. Growing companies especially need to stay on top of this stuff. I always tell people to start quarterly just to build the habit, then bump it to monthly once you're comfortable. Oh and definitely set a calendar reminder because this is the first thing that gets dropped when you're swamped. Trust me on that one.
Investors want to see you've actually planned this stuff out, not just throwing numbers around hoping something sticks. Show them how their money strengthens your balance sheet - more cash, better debt ratios, assets that'll drive revenue. They're obsessed with working capital needs and debt-to-equity ratios because most founders completely bomb the cash flow timing part. Honestly, it's painful to watch sometimes. Your projections help them figure out their own returns too. Just make sure everything connects to your business plan - they'll check, trust me.
So basically depreciation chips away at your fixed assets' book value each period. Your accumulated depreciation keeps growing while net PP&E shrinks - it's just how you show assets getting worn down over time. Most people use straight-line since it's simple math. Add it to accumulated depreciation (goes on the liability side) but keep your gross assets unchanged. Here's where it gets annoying though - that depreciation expense also hits your P&L and flows into retained earnings. I always mess this part up honestly. Just make sure everything still balances out when you're done.
So your income statement and balance sheet are totally linked together. Net income flows straight into retained earnings on the balance sheet. Depreciation hits your assets too. Any new loans or equity you're planning will show up on the balance sheet but also mess with your interest expenses on the income statement. Honestly, I always start with income projections first - makes way more sense that way. Then build everything else around those numbers. It's like doing a puzzle where all the pieces have to match up perfectly or you'll be pulling your hair out trying to figure out why nothing balances.
Honestly, the most embarrassing mistake is when your balance sheet doesn't actually balance - happens more than you'd think! Don't get too optimistic with cash flow projections either. Seasonal stuff will bite you if you forget about it, especially working capital changes. Update your assumptions as you go (accounts receivable, inventory turnover, all that). Oh and build in realistic payment terms - customers never pay as fast as you hope they will. Double-check your formulas before presenting because there's nothing worse than realizing you messed up basic math in front of everyone.
So sensitivity analysis is basically stress-testing your balance sheet projections - you change key assumptions and see what happens to your numbers. Like tweaking sales growth, inventory turnover, payment terms, stuff like that. Honestly it's super helpful because you'll catch things you'd totally miss otherwise. Instead of one "this is probably right" projection, you get a whole range of what could happen. I'd start with maybe 3-4 of your biggest assumptions first - don't go crazy trying to test everything at once. It really helps you prep for different scenarios instead of just hoping your best guess works out.
Honestly just use Excel for this - most people already know it and you can set up formulas to auto-calculate everything based on your assumptions. Google Sheets works too if you need to share it with others. There are fancier options like QuickBooks or those expensive tools like Adaptive Insights, but unless you're doing something super complex, why overcomplicate it? Start with your base year numbers, then create cells for growth rates and other key drivers. I mean, I've seen people spend weeks evaluating software when they could've just built the whole thing in Excel already.
So benchmarks are basically your reality check for balance sheet projections. Compare your debt-to-equity, current ratios, asset turnover against industry standards - otherwise you might be way off. Like if you're projecting inventory turnover at 3x but industry average is 8x? That's gonna raise eyebrows. Pull data from RMA or IBISWorld first. Then adjust your working capital assumptions and debt levels to match what's actually happening in your space. Honestly, I've seen people get too creative with their numbers and it backfires. Short version: use benchmarks to keep your projections grounded.
So equity projections are basically tracking how much your business is worth over time - like a report card for your company's value. Investors will dig into these numbers hard when they're deciding whether to fund you. They show if you're actually building wealth through profits you keep, dividends you pay out, or new money coming in. Your balance sheet won't add up without them, which is kind of embarrassing to explain later. The tricky part? Your retained earnings better match what your income statement says, or you'll look like you don't know what you're doing. It's honestly one of those things that seems boring until it matters.
Track your debt-to-equity ratio, current ratio, and working capital changes over time by comparing projected balance sheets across periods. That's honestly where you'll catch cash flow problems before they mess you up. You can run "what if" scenarios too - like what happens if sales tank 20%? Most companies don't bother with this stuff until it's too late, which is crazy to me. Short version: projected sheets help you stay ahead of problems instead of constantly putting out fires.
-
Great designs, really helpful.
-
Requested a complete pitch deck. Delivered immediately and with high quality well researched content.