Projected Income Statement For Next Five Years Project Feasibility Report Submission For Bank Loan

Rating:
90%
Projected Income Statement For Next Five Years Project Feasibility Report Submission For Bank Loan
Slide 1 of 6
Favourites Favourites

Try Before you Buy Download Free Sample Product

Audience Impress Your
Audience
Editable 100%
Editable
Time Save Hours
of Time
The Biggest Sale is ending soon in
0
0
:
0
0
:
0
0
Rating:
90%
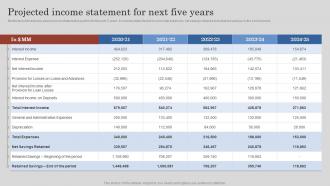
Mentioned slide explains about income statement projection for the next 5 years. It includes total interest income, total expenses, net savings retained and retained savings by the end of period. Deliver an outstanding presentation on the topic using this Tasks, Start, Duration. Dispense information and present a thorough explanation of Projected Income Statement, Next Five Years Project, Feasibility Report, Submission For Bank Loan using the slides given. This template can be altered and personalized to fit your needs. It is also available for immediate download. So grab it now.

People who downloaded this PowerPoint presentation also viewed the following :

FAQs for Projected Income Statement For Next Five Years Project Feasibility Report Submission

Key factors for income projection include historical revenue data, market trends, seasonal variations, customer retention rates, and planned business initiatives. These elements enable organizations to forecast realistic revenue streams by analyzing past performance, anticipating market shifts, and accounting for operational changes, ultimately delivering more accurate financial planning and strategic decision-making capabilities.

Historical data serves as the foundation for accurate income projections by revealing revenue patterns, seasonal trends, growth trajectories, and customer behavior cycles that inform forecasting models. Through analysis of past performance, businesses can identify consistent revenue drivers, anticipate market fluctuations, and adjust projections accordingly, ultimately delivering more reliable financial planning and strategic decision-making capabilities.

Startups typically rely on market research, competitor analysis, customer surveys, and pilot program data to project income, while established businesses use historical revenue trends, seasonal patterns, customer retention rates, and pipeline analysis. Established companies benefit from predictable data streams and proven sales cycles, whereas startups must combine industry benchmarks with strategic assumptions, ultimately requiring more conservative projections and scenario planning.

Market analysis enhances income projections by providing critical insights into customer demand, competitive positioning, pricing strategies, and emerging market trends. Through comprehensive market research, businesses can validate revenue assumptions, identify growth opportunities, and adjust forecasting models based on real market conditions, ultimately delivering more accurate financial planning and strategic decision-making capabilities.

Seasonality significantly impacts retail income projections through fluctuating consumer demand patterns, holiday shopping surges, weather-dependent purchases, and inventory cycle variations. Retailers like clothing stores, toy companies, and garden centers must account for peak seasons, off-season downturns, and promotional periods, ultimately enabling more accurate forecasting and strategic inventory management for sustained profitability.

Common mistakes in income projections include overestimating revenue growth, underestimating seasonal fluctuations, ignoring market competition, using outdated data, and failing to account for economic cycles. These errors can mislead strategic planning by creating unrealistic expectations, poor resource allocation, and inadequate cash flow management, with many organizations finding that conservative, data-driven projections ultimately deliver more reliable business outcomes.

Businesses should revisit income projections quarterly for regular performance tracking, with additional updates triggered by significant market changes, new product launches, or economic shifts. Many organizations find that combining scheduled quarterly reviews with event-driven adjustments enables more accurate forecasting, better resource allocation, and enhanced strategic decision-making in an increasingly dynamic business environment.

**INPUT**: What software tools or templates are most effective for creating income projections? **OUTPUT**: Effective income projection tools include Excel with built-in financial templates, QuickBooks for integrated accounting data, PlanGuru for comprehensive forecasting, Prophix for enterprise planning, and specialized platforms like LivePlan or Adaptive Insights. These solutions streamline financial modeling by automating calculations, integrating historical data, and enabling scenario planning, with many organizations finding that cloud-based tools deliver enhanced collaboration and real-time updates for strategic decision-making. [Word count: 59 words]

Sensitivity analysis improves income projection accuracy by testing how changes in key variables like pricing, volume, and costs affect projected outcomes, identifying which assumptions most significantly impact results. Through scenario modeling, businesses can quantify risks across different market conditions, economic shifts, and competitive pressures, ultimately delivering more robust forecasts and enabling better strategic decision-making in uncertain environments.

Risk mitigation strategies for income projections include diversifying revenue streams, maintaining conservative estimates, building contingency reserves, implementing flexible pricing models, and establishing strong customer retention programs. These approaches help businesses navigate market uncertainties by reducing dependency on single income sources, preparing for downturns, and adapting quickly to changing conditions, ultimately delivering more stable financial performance and competitive resilience.

Economic conditions significantly impact income projections by altering consumer spending patterns, interest rates, inflation levels, and market demand across sectors. During economic downturns, businesses typically adjust projections downward to reflect reduced revenues, while growth periods enable more optimistic forecasting, with many organizations finding that flexible projection models help navigate uncertainty and maintain strategic planning accuracy.

Key metrics for evaluating income projection accuracy include mean absolute percentage error (MAPE), forecast bias, variance analysis, correlation coefficients, and root mean square error (RMSE). These analytical tools enable organizations to measure prediction reliability, identify systematic deviations, and refine forecasting models, with many financial services and retail companies finding that consistent accuracy tracking ultimately delivers improved budgeting precision and strategic planning confidence.

Income projections demonstrate a business's revenue potential, growth trajectory, and repayment capacity through detailed financial forecasting, market analysis, and strategic planning. These comprehensive projections enable investors and lenders to assess risk levels, evaluate return potential, and make informed funding decisions, with many financial institutions finding that well-structured projections significantly enhance loan approval rates and investment attractiveness.

Integrating income projections with cash flow analysis provides comprehensive financial visibility by aligning revenue forecasts with actual cash timing, enabling better liquidity management and strategic planning. This strategic combination helps organizations anticipate funding needs, optimize resource allocation, and make informed investment decisions, with many financial teams finding that synchronized projections ultimately deliver enhanced operational efficiency and competitive advantage.

Demographic shifts influence long-term income projections by altering consumer demand patterns, workforce availability, and market size dynamics across different age groups, income levels, and geographic regions. These changes enable businesses to identify emerging opportunities in sectors like healthcare for aging populations or technology for younger demographics, while adjusting resource allocation strategies to capitalize on evolving market conditions and consumer preferences.

Ratings and Reviews

90% of 100
Review Form
Write a review
Most Relevant Reviews
  1. 80%

    by Eddie Sandoval

    Great designs, Easily Editable.
  2. 100%

    by Thomas Garcia

    I want to express my gratitude to SlideTeam’s presentation design services team for helping me create the best presentation of my life!

2 Item(s)

per page: