


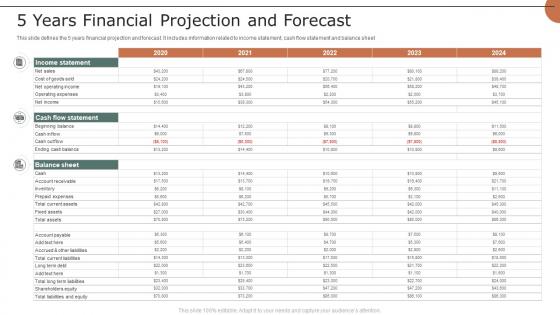
5 Years Financial Projection And Forecast




Try Before you Buy Download Free Sample Product
 Impress Your
 Audience
 100%
100% Editable
 Save Hours
 of Time


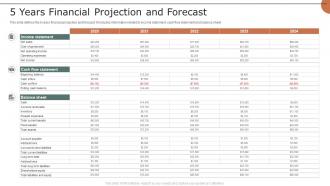
This slide defines the 5 years financial projection and forecast. It includes information related to income statement, cash flow statement and balance sheet
People who downloaded this PowerPoint presentation also viewed the following :
5 Years Financial Projection And Forecast with all 6 slides:
Use our 5 Years Financial Projection And Forecast to effectively help you save your valuable time. They are readymade to fit into any presentation structure.





FAQs for 5 Years Financial
So you need five main things for a solid financial projection: income statement, cash flow, balance sheet, your key assumptions, and sensitivity analysis. Honestly, the assumptions part is where most people mess up - like, you can't just say "sales will jump 20%" without backing it up somehow. Build out three scenarios too (best case, realistic, worst case) because investors love seeing that range. Oh and definitely plan for 3-5 years out, then update quarterly when real numbers come in. I learned this the hard way when my first projections were way too optimistic!
Look at your revenue from the past 2-3 years first - you'll spot trends and seasonal stuff pretty easily. Factor in whatever's changing: new products, market shifts, contracts ending. Multiple scenarios are clutch here (best/worst/realistic) since nobody can predict the future perfectly. I like combining top-down (market size × your share) with bottom-up forecasting where you roll up individual customer predictions. Oh, and definitely run everything by your sales team - they see what's actually happening while you're staring at spreadsheets all day.
Look, historical data is like your starting point for any financial projection that's actually worth something. It shows you the patterns and trends that'll probably keep happening. You can't just make stuff up and ignore what actually went down, you know? But here's the thing - don't just copy-paste those numbers forward. Markets change, your business evolves. Maybe you're launching something new or the whole industry's shifting. Start with what happened before, then tweak it based on what you think's coming. That's honestly how most decent projections get built.
Honestly, monthly updates work best for most businesses - quarterly is too slow these days. Fast-moving industries especially need that frequent check-in. Major changes though? Update immediately. New contract comes in, market goes crazy, surprise expense hits - don't wait for your monthly review. Your projections are basically worthless if they don't match what's actually happening. I know it feels tedious sometimes (trust me, been there), but start with monthly and adjust from there. You'll get a feel for what your business needs pretty quickly.
Dude, don't be crazy optimistic about when money's actually gonna come in. Costs always end up higher than you think - those monthly subscriptions and fees pile up like crazy. Also that whole "hockey stick growth" thing where everything supposedly takes off after a year? Total BS and investors hate seeing it. Customer acquisition takes forever, there's gonna be slow months, and you'll need cash on hand when things start picking up. Honestly just assume everything will take longer and cost more. Then make a few different scenarios so you're not totally screwed when reality hits.
So sensitivity analysis is basically stress-testing your assumptions to see what happens when things go sideways. Pick your 3-4 biggest uncertainties and model how 20% swings would mess with your results. Yeah, it's kinda tedious to set up initially, but you'll thank yourself later. Instead of one rosy forecast, you get multiple scenarios that actually prepare you for reality. Like maybe a 10% revenue hit destroys everything, or maybe it barely registers - good to know either way, right? It shows you which variables really move the needle vs the ones that don't matter as much.
Honestly, rolling forecasts are your best bet - just update monthly instead of pretending your annual budget means anything when everything's chaos. Scenario planning helps too, like mapping out best/worst case so you're not blindsided. Zero-based budgeting makes you justify every expense from zero, which is kind of a pain but keeps things tight. Oh, and driver-based models automatically adjust expenses based on your actual metrics - pretty neat if you ask me. I'd start with rolling forecasts though, they're the quickest way to stop feeling completely lost. Way easier than the other stuff and you'll see results fast.
Economic factors will totally wreck your financial projections if you're not careful. Interest rates, inflation, market volatility - all that stuff directly hits your revenue and costs. Multiple scenarios are your best friend here: optimistic, pessimistic, and somewhere realistic in between. I got burned on this back in 2020 when everything went sideways. Update your projections every quarter too, because honestly the economy changes faster than you think it will. Don't just set your numbers once and call it done - that's asking for trouble.
Honestly, just use Excel. You've probably got it already and literally everyone expects to see Excel models anyway. Google Sheets is solid if your team needs to collaborate in real-time - I actually prefer it sometimes for that reason. There are fancier options like Anaplan but they're total overkill unless you're running some massive operation with tons of business units. Start with Excel, build something simple first. You can always move to something else later if you run into walls. Trust me, investors would rather see a clean Excel model than some random specialized tool they've never heard of.
Grab 2-3 years of monthly sales data and look for patterns. December retail spike? Summer landscaping boom? Plot each month as a percentage above or below your yearly average - that's your baseline. Honestly, most people just divide by 12 and call it a day, but seasonal businesses get crushed doing that. Once you see the trends, bake those fluctuations into your monthly forecasts. Don't spread revenue evenly! Also adjust when you expect cash to actually hit your account and plan inventory around those cycles. The data usually tells a pretty clear story if you actually look at it.
Think of scenario planning as your backup plan for when things go sideways - and trust me, they will. You map out three versions: best case, worst case, and what'll probably actually happen. Helps you catch cash problems early instead of scrambling later. Your investors will appreciate seeing you've thought beyond just the rosy projections too. I'd start basic with those three scenarios, then get fancier once you've got the hang of it. Honestly beats winging it and hoping for the best.
Look at what similar companies are doing first - industry reports, competitor research, chatting with other founders helps tons. Yeah, you're basically making educated guesses, but honestly everyone does that initially. Create three scenarios: conservative, realistic, and optimistic. Don't try projecting every little detail - just focus on the metrics that actually matter for your business. Update monthly as real data comes in. Oh, and these projections will change constantly as you learn more, which is totally normal.
Track your CAC, lifetime value, burn rate, and MRR if you've got recurring stuff. Pipeline metrics are clutch - honestly way more useful than most people think since they show what's coming before it actually lands. Don't sleep on gross margin either, that's where you'll catch unit economics problems early. Also worth tracking how accurate your projections are over time so you can see where you're always wrong lol. I'd stick to maybe 3-5 metrics that actually connect to how you make money instead of tracking everything under the sun.
Dude, templates are a game changer for financial forecasts. Charts and graphs make your numbers actually readable instead of just throwing spreadsheets at people. I always use color coding for the important stuff - executives love that. Side-by-side scenario comparisons work great too. Honestly, I've watched brilliant forecasts get completely ignored because they looked boring as hell. Bar charts for growth trends are super simple to start with. Clean tables for your assumptions too. Oh and don't go crazy with fancy stuff - sometimes less is more. You want them focused on your story, not figuring out what they're looking at.
Okay so first thing - tell a story that ties your numbers to the actual market opportunity and what makes you different. Show three scenarios: conservative, realistic, and optimistic (investors eat that stuff up). Your assumptions need to be super clear because nobody trusts random numbers that just materialize. Key metrics are everything - focus on stuff like customer acquisition costs or MRR, whatever matters in your space. Honestly, ditch the spreadsheet dump and use clean visuals instead. Then wrap up each section explaining what those numbers actually mean for growth and returns.
-
Great templates that you can use in your next keynote or conference. They are perfect for quick and visually-engaging delivery.
-
The slides come with appealing color schemes and relevant content that helped me deliver a stunning presentation without any hassle!