

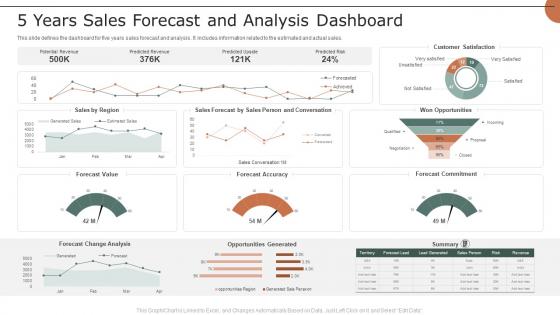
5 Years Sales Forecast And Analysis Dashboard




Try Before you Buy Download Free Sample Product
 Impress Your
 Audience
 100%
100% Editable
 Save Hours
 of Time


This slide defines the dashboard for five years sales forecast and analysis . It includes information related to the estimated and actual sales.
People who downloaded this PowerPoint presentation also viewed the following :
5 Years Sales Forecast And Analysis Dashboard with all 7 slides:
Use our 5 Years Sales Forecast And Analysis Dashboard to effectively help you save your valuable time. They are readymade to fit into any presentation structure.





FAQs for 5 Years Sales Forecast
Time series works great if you're in retail or other predictable industries. For B2B, regression models let you track those early warning signs. Pipeline forecasting is your friend when deals take forever to close. Machine learning sounds fancy but honestly most teams don't need it yet. What industry are you in? SaaS folks love their cohort analysis, manufacturing usually goes seasonal. Your data quality matters more than the fancy method though. If you're just starting out, try moving averages mixed with whatever your sales team's saying. Sometimes their gut instincts are surprisingly spot-on.
Dude, your sales data is like having a time machine - you can spot patterns you'd never catch otherwise. Look for seasonal spikes, how random events hit your numbers, stuff like that. Without it you're basically throwing darts blindfolded. Get at least 2-3 years if you can, and honestly? Just plot it out visually first. Holiday bumps are obvious, but watch for weird customer shifts too. Oh, and make sure you're tracking everything the same way throughout - inconsistent data will mess you up fast. Trust me, patterns jump out way more than you'd expect.
Look, market research fills in what your historical data misses - customer behavior shifts, what competitors are doing, broader trends that'll mess with your sales pipeline. It helps you catch opportunities or problems before they actually hurt your numbers. Use it to double-check your assumptions and tweak forecasts from there. Honestly, I think most people underestimate how much the market can shift quarter to quarter. I'd do quarterly pulse checks and plug those findings straight into your forecasting models. Makes predictions way more reliable.
Dude, AI is actually perfect for this stuff. It'll dig through all your old sales data way faster than you ever could - finds patterns in seasonality, customer habits, market shifts, whatever. Way more accurate than Excel guesswork, trust me. Salesforce Einstein or HubSpot's analytics tools do most of the work automatically. Python models too if you're feeling fancy. Only thing is, don't go crazy right away. Test it on like one product line first, see how it goes, then expand from there. Saves you from any major screwups.
Honestly, there's like four main things you need to nail down for decent sales forecasting. Pipeline velocity is huge - basically how fast your deals actually move through each stage. Then track conversion rates at every step, plus your average deal size and how long sales cycles typically run. I know it sounds obvious, but so many teams completely ignore their historical data (wild, right?). Leading indicators matter too - stuff like qualified leads coming in and your demo-to-close rates. Throw all that together and you'll crush those forecasts instead of just winging it based on last quarter.
Monthly updates are usually your sweet spot, though quarterly works too if you're not in some crazy unpredictable industry. I'd go monthly for retail or anything seasonal - you'll spot trends before they bite you. B2B with those endless sales cycles? Quarterly's probably fine. Here's the thing though - whatever you pick, stick with it. Don't be that person who only updates forecasts when the numbers tank (we've all been there). Weekly's just gonna drive you nuts with all the noise. Trust me, those random fluctuations aren't worth the headache.
Don't get stuck in the spreadsheet trap - you know when your forecast looks perfect but has zero connection to what's actually happening? Classic mistake. Also avoid banking too much on old data without checking if the market's shifted. Sales teams hate when you're overly optimistic about close rates (learned that one the hard way). Seasonal stuff will bite you if you're not paying attention. Talk to your reps regularly about what they're seeing. Set up monthly reviews where you compare what you predicted vs reality, then tweak your approach.
Dude, seasonal trends are absolutely critical for forecasting - ignore them and you'll be screwed during peak seasons. Picture trying to predict summer ice cream sales with January numbers, right? Plot your monthly sales first to see the obvious patterns. You'll want 2-3 years of data minimum to spot reliable trends. Then either use seasonal multipliers on your baseline or grab a model that catches seasonality automatically. Honestly, this stuff can completely tank your accuracy if you mess it up, but it's not rocket science once you see the patterns.
So basically, economic indicators give you a heads up on what's coming for your sales. GDP growth and unemployment rates? Those directly hit how much people spend. When folks feel good about their jobs and money, they buy stuff. Interest rates mess with everything - both what businesses invest in and what consumers can afford to finance. Inflation's another big one since it changes people's budgets pretty fast. Honestly, consumer confidence might be the most telling indicator out there. The trick is figuring out which 2-3 indicators actually matter for your industry, then just bake those into your forecasts as early warning signals.
Dude, you've gotta get marketing and sales actually talking to each other - like every week, not just those awkward quarterly meetings. Have marketing share their lead data and campaign numbers while sales gives feedback on what's actually converting. Most companies suck at this basic stuff, honestly. But here's the thing - when both teams sync up on lead scoring and territory planning, your forecasts get so much better. Marketing sees the top of the funnel, sales knows what closes. Put it all in one dashboard they can both mess with. Oh, and don't forget seasonal trends - that stuff matters way more than people think.
Honestly, it depends on what you're working with. Got historical data and a stable market? Go quantitative - the math stuff just works better for consistency. But if you're launching something new or the market's all over the place, expert opinions and research surveys can spot things data can't. I mean, numbers don't always catch emerging trends, you know? Quantitative feels more reliable most of the time, but qualitative's clutch for reading the room. Mix both if you can swing it. Different products need different approaches anyway - what works for one line might totally flop for another.
Honestly, you've gotta start forecasting way more often when things get crazy like this. Monthly or weekly instead of quarterly - I know it sounds like overkill but trust me on this one. During the last mess we went through, I was still doing quarterly updates like an idiot and got blindsided. Build out three scenarios: best case, worst case, and something realistic in the middle. Don't just look at your sales numbers either - watch customer inquiries, pipeline shifts, what competitors are doing. That stuff shows up first. Oh and make sure leadership actually understands you're giving them ranges, not guarantees.
Just lead with your main numbers first - gets everyone on the same page right away. But honestly? The real magic happens when you explain what's actually driving those predictions. I've watched way too many people present forecasts like they're set in stone when really we're all just making educated guesses here! Always throw in confidence levels and different scenarios - best case, worst case, you know the drill. Don't use fancy sales speak if your audience doesn't get it. Oh, and definitely set up regular check-ins to tweak things as new info comes in.
Honestly, just grab a spreadsheet and look at your last 6-12 months of sales data. Find the patterns - what months were strong, which products sold best, that kind of thing. I know it sounds boring but it actually works really well for most small businesses. Track where your leads come from and what percentage convert, then apply those numbers to whatever's in your pipeline right now. Don't forget about seasonal stuff or any big marketing pushes you've got planned. Oh, and update it monthly - you'll get way better at this once you start comparing what actually happened versus what you predicted.
Dude, customer feedback is honestly like having a crystal ball for your forecasting. It shows you if your predictions actually line up with reality or if you're totally off base. Historical data only tells part of the story - people's feelings about your product often predict what they'll buy way better than spreadsheets do. You can catch trends early, like when customers start complaining about something that might hurt sales later. I'd set up surveys, check reviews regularly, maybe even hop on calls with customers occasionally. Then actually use what they tell you to adjust your models. Oh, and don't just collect feedback once and call it done - make it ongoing.
-
You guys are life-saver when it comes to presentations. Honestly I cannot do much without your services. Thank you!!!
-
It's always a delight to see new templates from you! I am extremely pleased with the fact that they are easy to modify and fit any presentation layout in seconds!