

Financial projection ppt ideas




Try Before you Buy Download Free Sample Product
 Impress Your
 Audience
 100%
100% Editable
 Save Hours
 of Time


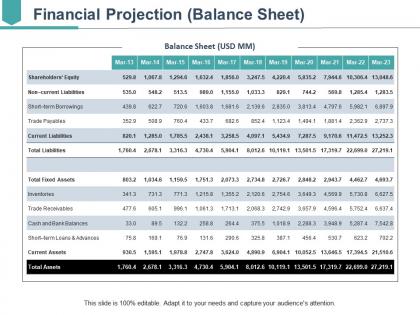
The financial projection analysis PowerPoint template helps a user to make his viewers understand how creating an in-depth analysis of each financial aspect is essential. The financial projections for startups PPT slide enable a presenter to make a comprehensive list of all recurring as well as nonrecurring costs, along with qualitative benefits, projected out over specific years. A user can take help of the financial projection for startup business sheet presentation template to provide an overall summary of the total costs comparing with benefits. The financial projections forecast PowerPoint slide is suitable for forecast of future revenues as well as expenses for the business. The projected financial statements PPT template enables a user to demonstrate how to create projections on a yearly basis that helps him and his team to think strategically about the current financial performance of their business, and establish a clear procedure to follow. A presenter can use a financial projections for startups presentation template to motivate his viewers to start planning and working on their own projections. The financial projections spreadsheet PPT slide enables you to describe multiple financial worksheets such as a balance sheet, cash flow statement, income statement, and many more. By taking help of the financial projection example template a user can highlight profitability of a project in forecasting as well as progress reports.Friendly feelings begin to flow due to our Financial Projection Ppt Ideas. An air of harmony will develop.
People who downloaded this PowerPoint presentation also viewed the following :
Financial projection ppt ideas with all 5 slides:
Clear the confusion with our Financial Projection Ppt Ideas. Give an accurate account of conditions.

FAQs for Financial
Honestly, start with GDP growth, inflation, and interest rates - that's your foundation. Employment numbers and consumer confidence are gold too since they show where people's wallets are headed. Don't ignore industry-specific stuff though, that can make or break you. If you're doing anything international, currency rates will mess with your margins big time. Oh, and commodity prices if they hit your costs directly (learned that one the hard way). Pick those first three, then add maybe 2-3 indicators that actually matter for your specific business. No point tracking random metrics that don't move your needle.
Look, historical data is basically your cheat sheet for forecasting. Pull at least 3-5 years if you've got it - more years usually equals better predictions. Plot everything on a timeline first and hunt for the obvious patterns. Revenue cycles, expenses, market ups and downs... they'll show you what actually moves your numbers. I'm big on spotting seasonal trends since they're usually the most reliable. Just watch out for weird one-off events that might throw things off. Way better than shooting in the dark, honestly.
Look, you can't just throw random numbers into your financial projections and hope they stick. Market analysis shows you what's actually going on - market size, how fast things are growing, what customers want, who you're up against. Without it, you're basically shooting in the dark. Like, if the whole industry is tanking, you can't realistically project 50% growth, you know? Plus it helps you catch stuff like seasonal patterns or pricing wars that'll mess with your revenue. Honestly, I'd grab some industry reports first - maybe check what competitors are doing - then build your models from there.
Two main ways to tackle this - bottom-up (estimate units sold x pricing) or top-down (total market size x your slice). Market research helps either way. Honestly though, most founders are ridiculously optimistic at first, so start conservative. Customer interviews are pure gold for checking if your assumptions actually make sense. If you've got early users, try cohort analysis. Otherwise build out best/worst/likely scenarios. I'd pick whichever method fits your business model, then cross-check with a second approach. The numbers should roughly align if you're on the right track.
So sensitivity analysis is basically stress-testing your financial projections. You change one variable at a time - like sales growth or costs - then see how much your forecasts shift. Pretty much asking "what if we're totally wrong about this?" which happens more than we'd like to admit lol. The point is figuring out which assumptions actually move the needle vs ones that don't matter much. I'd start with your three biggest assumptions first. That way you can build better scenarios and won't get blindsided if reality doesn't match your spreadsheet.
Dude, honestly? Everyone screws up the same ways at first. You'll be way too optimistic about revenue and totally lowball your expenses - I did it too. Don't use the same numbers forever either, stuff changes constantly. Seasonal swings will bite you if you ignore them. Oh and build in cushion for random disasters because something always goes sideways. I learned that one the hard way. Make conservative projections but keep them realistic. Run best case, worst case scenarios so you're not flying blind. Just stay flexible and adjust when reality smacks you.
Honestly, I'd say quarterly works best for most people. Monthly sounds good in theory but let's be real - who actually has time for that? The main thing is jumping on it when you see big differences between what you projected and what's actually happening. Market shifts or major business changes? Update immediately, don't wait. I learned this the hard way when I waited too long once and my numbers were completely off. Annual reviews are basically useless - way too much changes in a year. Set a quarterly reminder and actually stick to it. Short bursts work better than constantly tweaking spreadsheets anyway.
Ugh, inflation is such a pain when you're trying to forecast anything financial. Your revenue numbers might look solid, but inflation basically eats away at what that money's actually worth. Plus everything costs more - labor, materials, you name it. I got burned by this during that crazy 2021-2022 period when prices went nuts. Now I always bake inflation assumptions into my projections, usually based on historical data or whatever economists are predicting. Honestly though? Run a few different scenarios with varying inflation rates. It'll show you how screwed (or not) you'd be in different situations.
Look, projections prove you're not just throwing darts at a board. Investors want to see you actually get your market and have realistic revenue goals. They'll definitely ask when you need money and what for - might as well be ready with solid numbers. ROI timelines are huge too since they need to know if you fit their investment strategy. Honestly, even if you think projections are kinda BS (which, let's be real, they often are), every investor will ask for them anyway. Just make sure you can defend your assumptions because they'll tear apart your math during the pitch.
Honestly, Excel or Google Sheets work great for most people - you probably already know how to use them anyway. QuickBooks Planning & Budgeting is solid if you want something fancier, or check out LivePlan and Adaptive Insights for automation stuff. I swear I've watched friends spend forever researching the "perfect" budgeting tool when they could've just started tracking things in a basic spreadsheet. Don't overthink it. Pick whatever you'll actually stick with consistently, then upgrade later if you need more features. Starting simple beats never starting at all.
Dude, you gotta dig into 2-3 years of your old data first. Month-to-month revenue, when cash gets tight, expense spikes - all that stuff. I totally screwed this up once and projected smooth growth, then BAM, January was brutal. Use percentages instead of fixed numbers. Like if your December is usually 40% above average, multiply that against whatever you're projecting. Short sentences work better for the math parts. Don't make everything look flat and steady or you'll get blindsided by cash flow issues. Those peaks and valleys matter way more than you think.
Make your numbers believable - nobody trusts projections that scream "wishful thinking." Put your assumptions right up front so people get how you landed on everything. Charts beat spreadsheet dumps every time. I learned this the hard way when my boss's eyes glazed over during a presentation full of tables. Always do three scenarios: optimistic, realistic, and pessimistic. Practice explaining WHY you think something will happen, not just rattling off figures. Oh, and have real data ready to back up your assumptions. Comparisons from similar companies help too - makes you look like you actually did your homework.
Honestly, charts are a lifesaver when dealing with financial stuff. Raw numbers just make your brain shut down after like 5 minutes. Bar charts work great for comparing things, line graphs show trends over time, and pie charts break down percentages - though I kinda hate pie charts personally. The cool thing is you can catch patterns right away that would take forever scrolling through Excel. Revenue suddenly dropping? You'll spot it instantly on a graph. Keep things clean and focus on whatever story the data's actually telling. Pick whichever chart type makes your point obvious at first glance.
Track your variance analysis first - actual vs what you projected. Also measure forecast accuracy percentage and do rolling forecasts to see if your predictions actually pan out. Cash flow timing is where things usually fall apart tbh, so watch that closely. Revenue recognition patterns matter too, plus when your expenses hit. I'd start with quarterly variance rates and then work backwards to figure out where you screwed up your assumptions. Way better than just crossing your fingers next quarter. Oh, and expense timing can totally wreck your accuracy if you're not careful about it.
So you make different versions of your financial projections - like best case, worst case, and realistic middle ground. Pick your main assumptions first, then tweak variables like revenue growth or costs for each scenario. Honestly, three scenarios is plenty because more than that and people's eyes glaze over. The trick is using assumptions that could genuinely happen, not crazy outliers. This way you get a range instead of betting everything on one number. Really helps when you're planning or trying to show investors you've actually thought this through properly.
-
Unique design & color.
-
Best Representation of topics, really appreciable.