

Pitch deck slide financial projection graph ppt templates




Try Before you Buy Download Free Sample Product
 Impress Your
 Audience
 100%
100% Editable
 Save Hours
 of Time


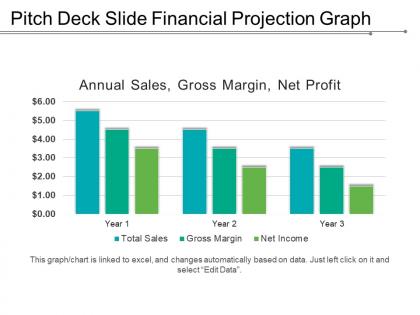
Effectively display your company’s revenues and expenses using this Pitch deck slide financial projection graph PPT template. Help your investors determine the past and future financial performance of your enterprise using this pitch deck financial PPT slide. Include gross margin, net income, and annual sales in this financial graph PPT slide. Assess the capability of generating future cash flows through report of the income and expenses. With an easy to understand graph used in this pitch deck financials PowerPoint template make complex numerical data simple with this visual representation. Compare the revenues, operating profit, and net profit of your organization with the balance sheet financial statement PPT template. Convey the simplified version of your information to the audience with this financial projections slide. This pitch deck financial projections slide is professionally designed with high-quality graphics. Download this ready to use PPT slide to generate an effective PowerPoint presentation, in less time.
People who downloaded this PowerPoint presentation also viewed the following :
Pitch deck slide financial projection graph ppt templates with all 5 slides:
Our Pitch Deck Slide Financial Projection Graph Ppt Templates encourage the audience to excercise free will. They will surely endorse your cause.



FAQs for Pitch deck slide financial projection
Financial projections in pitch decks include revenue forecasts, expense breakdowns, cash flow statements, profit margins, and funding requirements over three to five years. These components demonstrate business viability by showcasing growth potential, operational efficiency, and return on investment, with many investors finding that realistic projections backed by market research and clear assumptions ultimately build credibility and strategic confidence.
Startups can effectively estimate five-year revenue forecasts by analyzing market size, identifying target customer segments, researching competitor pricing models, and applying bottom-up calculations based on conversion rates and customer acquisition costs. While early projections involve uncertainty, companies like SaaS platforms and e-commerce businesses often use cohort analysis and seasonal trends to create realistic growth trajectories, ultimately delivering credible financial narratives that attract investor confidence.
Financial projection tools include Excel, Google Sheets, QuickBooks, PlanGuru, LivePlan, Prophix, and specialized platforms like Adaptive Insights. These solutions streamline forecasting by automating calculations, integrating real-time data, and enabling scenario modeling, with many startups and established businesses finding that cloud-based platforms deliver enhanced collaboration, accuracy, and investor-ready presentations.
Determining assumption metrics requires analyzing historical industry data, market research, and comparable company performance to establish realistic growth rates, customer acquisition costs, and revenue projections. Start with conservative estimates for key drivers like conversion rates, pricing models, and operational expenses, then validate these against industry benchmarks and competitor analysis, ultimately creating multiple scenarios that demonstrate scalability while maintaining credibility with investors.
Common pitfalls include overly optimistic revenue forecasts, unrealistic market share assumptions, underestimating operational costs, lacking supporting data for projections, and presenting inconsistent metrics across slides. These presentation errors undermine credibility with investors by creating doubt about market understanding and business viability, with many successful startups finding that conservative, well-researched projections ultimately deliver stronger investor confidence and strategic partnerships.
Market research enhances financial forecast credibility by providing data-driven validation for revenue assumptions, customer acquisition rates, pricing strategies, and market penetration timelines. Through comprehensive market analysis, startups can ground their projections in real customer demand patterns, competitive benchmarks, and industry growth rates, with investors finding that research-backed forecasts demonstrate strategic planning capabilities and realistic business understanding.
Including a break-even analysis demonstrates your understanding of operational sustainability and shows investors when your venture will become profitable, covering fixed costs, variable expenses, and revenue thresholds. This analysis enables investors to assess risk more accurately, understand cash flow requirements, and evaluate timeline expectations, with many finding that startups presenting clear break-even projections secure funding more effectively.
Cash flow projections should present monthly breakdowns for the first year, quarterly for years two through five, highlighting key metrics like burn rate, runway, and break-even timing. Successful startups often include scenario modeling with conservative, realistic, and optimistic cases, while clearly showing when additional funding rounds might be needed, ultimately demonstrating financial discipline and strategic planning that builds investor confidence.
Operating expenses directly impact profitability projections by determining your burn rate, scalability potential, and path to profitability through categories like personnel costs, marketing spend, technology infrastructure, and operational overhead. These projections help investors assess your cost structure efficiency and growth sustainability, with many startups finding that demonstrating controlled expense scaling while maintaining revenue growth ultimately delivers stronger valuations and funding confidence.
Startups demonstrate growth potential through financial projections by showcasing scalable revenue models, realistic market expansion timelines, and clear paths to profitability with conservative assumptions. These projections should highlight key metrics like customer acquisition costs, lifetime value ratios, and unit economics, with many investors finding that startups emphasizing sustainable growth trajectories and milestone-based scaling ultimately secure funding more effectively.
A three to five-year timeframe proves most effective for pitch deck financial projections, providing sufficient detail for near-term planning while demonstrating long-term growth potential and scalability. This horizon enables investors to evaluate immediate market traction, assess operational milestones, and understand strategic expansion plans, with many venture capital firms finding that this timeframe balances realistic forecasting with ambitious growth trajectories.
Sensitivity analysis can be integrated into financial projections by creating multiple scenarios that test key variables like revenue growth rates, customer acquisition costs, market penetration rates, and operational expenses. Through dynamic modeling tools, startups can demonstrate how changes in critical assumptions impact profitability, cash flow, and valuation, ultimately helping investors understand risk factors while showcasing strategic flexibility in varying market conditions.
Extrinsic factors include market conditions, economic trends, regulatory changes, competitive landscape, industry growth rates, and technological disruptions. These external variables significantly impact revenue forecasts, cost structures, and investment requirements, with many startups finding that comprehensive market analysis, regulatory compliance costs, and competitive positioning ultimately determine funding success and investor confidence in increasingly dynamic business environments.
Tech financial projections typically emphasize rapid user acquisition, recurring revenue streams, and scalability metrics, while traditional businesses focus on steady revenue growth, inventory management, and operational cash flow patterns. Tech companies often project exponential growth curves with initial losses followed by profitability, whereas traditional models show more linear progression, with many investors finding that tech projections require scenario planning for market penetration and customer lifetime value optimization.
Seasonality significantly impacts revenue projections by creating predictable fluctuations that affect cash flow, resource allocation, and growth trajectories throughout the year. Businesses should address this by incorporating historical seasonal patterns, adjusting monthly forecasts accordingly, and presenting both seasonal and normalized annual figures, with many investors finding that transparent seasonal modeling demonstrates sophisticated financial planning and realistic market understanding.
-
Good research work and creative work done on every template.
-
Presentation Design is very nice, good work with the content as well.