

Startup financial pitch deck template key financial projections for upcoming years





Try Before you Buy Download Free Sample Product
 Impress Your
Audience
 100%
Editable
 Save Hours
of Time


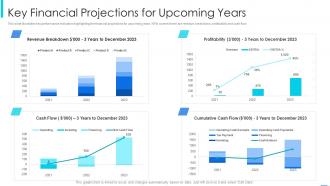
This slide illustrates key performance indicators highlighting the financial projections for upcoming years. KPIs covered here are revenue breakdown, profitability and cash flow
People who downloaded this PowerPoint presentation also viewed the following :
Startup financial pitch deck template key financial projections for upcoming years with all 7 slides:
Use our Startup Financial Pitch Deck Template Key Financial Projections For Upcoming Years to effectively help you save your valuable time. They are readymade to fit into any presentation structure.






FAQs for Startup financial pitch deck template key financial projections
Ok so you need five main things for your startup projections: revenue forecasts, expense breakdowns, cash flow statements, P&L projections, and how much funding you'll need. Revenue timing is where most people mess up - seriously, it always takes way longer than you think to actually hit those numbers. Break down your expenses into fixed stuff like rent and variable costs that grow with you. Cash flow is honestly the most important part because you need to know exactly when you're gonna run out of money. Do 3-5 years out, then update every quarter when real data comes in. Oh and don't get too fancy with the spreadsheets at first.
Look at your addressable market first, then figure out realistic conversion rates from there. I'd model each revenue stream separately since subscriptions are completely different beasts than one-time purchases. Three scenarios work best - conservative, realistic, optimistic. Your first projections will definitely be off anyway, so don't stress too much about perfection. Use competitor data but don't just steal their growth patterns. Sales cycles take forever, so factor that in along with seasonality and competition. Document everything so you can tweak assumptions as you actually learn what works.
Dude, market research is like your sanity check for financial projections. Without it, you're just throwing random numbers around hoping they stick. Look at 3-5 similar companies first - their conversion rates, churn, how much they spend getting customers. That's your starting point. Can't tell you how many times I've seen projections claiming they'll grab 50% market share year one when most startups are lucky to hit 0.1%. Industry benchmarks keep you grounded on stuff like unit economics and growth rates. Otherwise you're basically writing fiction instead of actual forecasts that investors might believe.
Build three models - conservative, realistic, and optimistic. Take your base case assumptions and tweak the big stuff (customer acquisition, pricing, costs) up or down by like 20-40%. Honestly, I spend most of my time on the worst-case scenario because it's where you figure out if you're actually screwed or not. Model different growth paths and potential delays too. Oh, and document everything so investors can poke holes in your logic - they're gonna do it anyway. The conservative model forces you to think about runway, which is probably more important than your dream numbers.
Honestly, the biggest mistake is being way too optimistic about revenue and totally lowballing your costs. That "hockey stick" growth chart where sales randomly explode? Investors roll their eyes at those. Don't forget boring expenses like taxes and replacing equipment - I always space on that stuff. Customer acquisition costs are another thing founders mess up constantly. Build three scenarios: realistic, best case, worst case. Actually, scratch that order - start with realistic first. Document everything so when investors grill you, you've got backup. Conservative assumptions will save your butt later.
Update them monthly if things are moving fast. Quarterly works if you're actually in a stable phase (rare for most of us lol). The real trick is catching trends early before they bite you. I know it's boring work, but projections only help if they're current. Too many people I know cling to old numbers because updating feels like a chore. Set a calendar reminder. Treat it seriously. Otherwise you're basically flying blind, and that never ends well when investors start asking questions.
Honestly, just nail the big four metrics and you're golden: revenue growth, gross margins, CAC, and LTV. Investors are obsessed with these numbers. Burn rate matters too - they want to see how long you can survive and when you'll actually make money. Oh, and if you're doing SaaS, definitely include MRR. Unit economics are smart to have since it shows you actually get your own business model. I always prep extra slides with detailed breakdowns just in case, but lead with the core stuff first. Some investors go deep, others just want the highlights.
Dude, just keep those financial projections simple and make the numbers tell a story. Show 3-5 years of the big stuff - revenue, gross margin, burn rate. But honestly? Everyone knows years 4-5 are total BS anyway lol. What investors actually care about are your assumptions and unit economics, not some crazy hockey stick you whipped up in Excel. Charts help a ton for making it digestible. Oh, and definitely include what you'll do with their cash - that's huge. The whole point is proving you actually get your business model and can think through growth realistically.
Look, seasonal swings and economic stuff will totally mess up your projections if you're not careful. Revenue can jump 30-50% between busy and dead months - retail gets slammed during holidays, B2B follows those weird budget cycles. Downturns hit everyone differently too (some businesses actually do better when everything's falling apart, go figure). Build monthly projections instead of just dividing your annual numbers by 12. You've got to run three scenarios: realistic, best case, and the "everything's on fire" version. Honestly, the cash flow stress-test during your worst months is what'll save you - that's how you figure out your real runway needs.
Honestly, split your operating costs into fixed stuff (rent, salaries, insurance) versus variable costs that move with revenue. Don't get ahead of yourself either - you're not hiring a VP of Sales in month 2 when you're still trying to figure out if anyone even wants your product. Build in extra cushion because trust me, everything costs more than you think. I'd track the big spending categories separately so you actually know where your money's disappearing to. Most crucial thing though? Tie your spending growth to real revenue hits, not just "oh it's been 6 months so time to expand."
Dude, cash flow is everything - way more important than those fancy profit projections. Like, your P&L might say you're killing it, but if customers take forever to pay while you're scrambling for payroll? Total nightmare. I learned this the hard way lol. You gotta track when money actually lands in your account, not just when it's "owed" to you. Map out every month - what's coming in, what's going out, and exactly when. That's how you'll catch those brutal cash crunches before they hit. Then you can figure out if you need a loan or maybe slow down spending. Trust me on this one.
Focus on the big three: customer acquisition, revenue per user, and churn. I'd start conservative - maybe 20% monthly growth for your base case. Then do optimistic and pessimistic versions too. Honestly, VCs roll their eyes at those crazy hockey stick projections everyone shows them. Ground everything in real data when you can - your early customers, competitor stuff, industry reports. The trick is proving you actually get what drives your growth instead of just throwing out nice-looking numbers. Oh, and set it up so you can tweak the variables easily later.
Honestly? Just start with Google Sheets or Excel. Most VCs still want spreadsheets anyway, so don't overthink it. Once you get bigger though, there's some solid stuff out there. LivePlan and PlanGuru have decent templates if you hate building from scratch. SaaS companies swear by ChartMogul for revenue stuff - I've seen it work pretty well. Manufacturing folks usually end up with NetSuite's planning tools, but that's overkill for early stage. My buddy went down this rabbit hole last year and wasted months on fancy software before his assumptions were even right. Get your numbers solid first, then worry about the pretty dashboards when you're raising serious money.
Make three projection scenarios - conservative, realistic, and optimistic. Base your realistic one on actual data you've got. The optimistic version can show serious upside (investors eat that up), but don't get crazy with some impossible hockey stick growth. Conservative projections help when things move slower than expected or stuff goes sideways. Here's what I've learned the hard way - pitch investors with your optimistic numbers but actually run your business using the conservative ones. That way you won't get blindsided when reality hits.
Dude, investors get bombarded with projections that are basically wishful thinking. Your reasoning is what makes you stand out. Explain why customer acquisition costs X or revenue grows at Y rate - shows you actually get your business model. Anyone can make a hockey stick graph, but solid logic based on real research or early data? That's different. Work backwards from your key drivers. Honestly, comparables from similar companies help too. When investors can see your assumptions aren't just pulled from thin air, they'll actually take your numbers seriously instead of tossing your deck in the "dreamer" pile.
-
Awesomely designed templates, Easy to understand.
-
Use of different colors is good. It's simple and attractive.