

Powerpoint-Präsentationsfolien für die Qualitätskontrolle




Try Before you Buy Download Free Sample Product
 Impress Your
Audience
 100%
Editable
 Save Hours
of Time


Unsere Powerpoint-Präsentationsfolien für die Qualitätskontrolle sind thematisch gestaltet, um einen attraktiven Hintergrund für jedes Thema zu bieten. Verwenden Sie sie, um wie ein Präsentationsprofi auszusehen.
People who downloaded this PowerPoint presentation also viewed the following :
Inhalt dieser Powerpoint-Präsentation
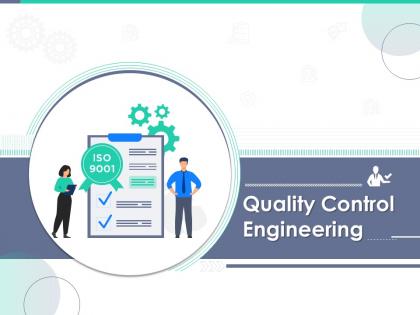
Folie 1 : Diese Folie stellt die Qualitätskontrolltechnik vor. Geben Sie Ihren Firmennamen an und beginnen Sie.
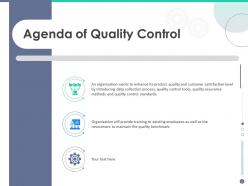
Folie 2 : Diese Folie zeigt die Agenda der Qualitätskontrolle.
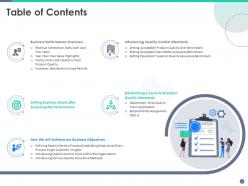
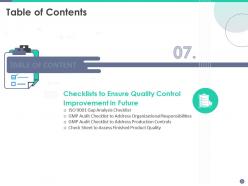
Folie 3 : Diese Folie präsentiert das Inhaltsverzeichnis der Präsentation.
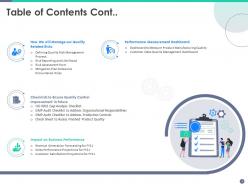
Folie 4 : Dies ist eine weitere Folie, die das Inhaltsverzeichnis der Präsentation fortsetzt.
Folie 5 : Diese Folie zeigt ein Inhaltsverzeichnis mit einem Überblick über die Geschäftsleistung.
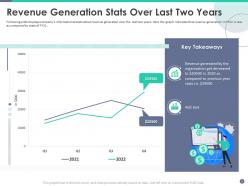
Folie 6 : Diese Folie zeigt Statistiken zur Umsatzgenerierung in den letzten zwei Jahren.
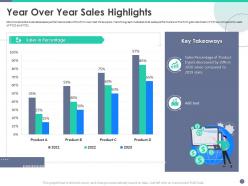
Folie 7 : Diese Folie zeigt Statistiken zur Verkaufsleistung des Unternehmens in den letzten drei Jahren.
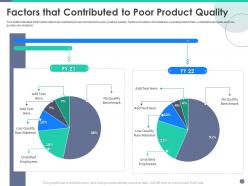
Folie 8 : Diese Folie veranschaulicht Informationen über verschiedene Faktoren, die zu einer schlechten Produktqualität beigetragen haben.
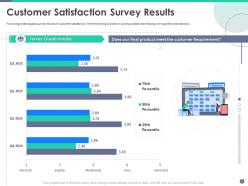
Folie 9 : Diese Folie zeigt die Umfrageergebnisse zur Kundenzufriedenheit.
Folie 10 : Diese Folie zeigt das Inhaltsverzeichnis der Präsentation an.
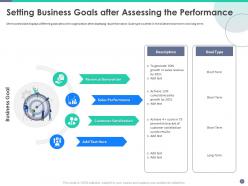
Folie 11 : Diese Folie zeigt das Festlegen von Geschäftszielen nach der Bewertung der Leistung.
Folie 12 : Diese Folie zeigt das Inhaltsverzeichnis der Präsentation.
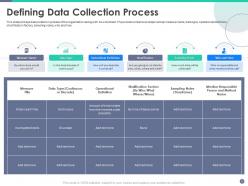
Folie 13 : Diese Folie zeigt den Datenerhebungsprozess der Organisation zusammen mit ihrem Arbeitsblatt.
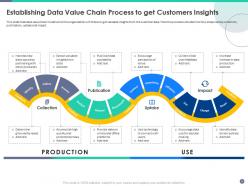
Folie 14 : Diese Folie zeigt die Etablierung des Datenwertschöpfungskettenprozesses, um Kundeneinblicke zu erhalten.
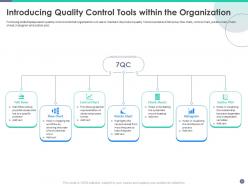
Folie 15 : Diese Folie zeigt sieben Qualitätskontrolltools, die das Unternehmen verwenden wird, um seine Produktqualität aufrechtzuerhalten.
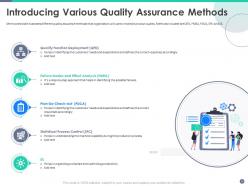
Folie 16 : Diese Folie stellt verschiedene Qualitätssicherungsmethoden dar, die Unternehmen verwenden, um die Produktqualität aufrechtzuerhalten.
Folie 17 : Diese Folie zeigt das Inhaltsverzeichnis der Präsentation.
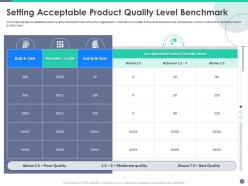
Folie 18 : Diese Folie zeigt einen akzeptablen Benchmark für die Produktqualität, der von der Organisation festgelegt wurde.
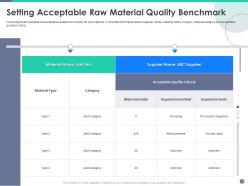
Folie 19 : Diese Folie zeigt das Festlegen eines akzeptablen Benchmarks für die Rohstoffqualität.
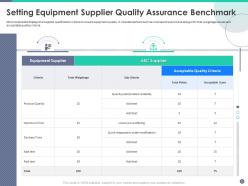
Folie 20 : Diese Folie zeigt die Lieferantenqualifizierungskriterien zur Sicherstellung der Gerätequalität.
Folie 21 : Diese Folie stellt das Inhaltsverzeichnis der Präsentation dar.
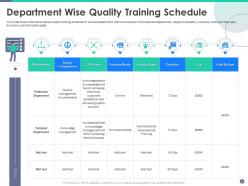
Folie 22 : Diese Folie zeigt Informationen zum Qualitätsschulungsplan für verschiedene Abteilungen.
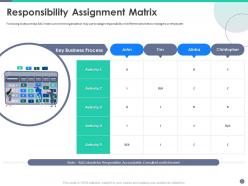
Folie 23 : Diese Folie stellt die RACI-Matrix dar, die die Organisation verwenden kann, um Managern oder Mitarbeitern die Verantwortung für verschiedene Aktivitäten zuzuweisen.
Folie 24 : Diese Folie zeigt das Inhaltsverzeichnis der Präsentation.
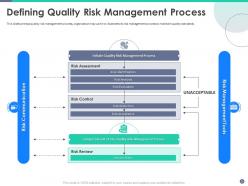
Folie 25 : Diese Folie stellt den Qualitätsrisikomanagementprozess dar. Die Organisation kann sie verwenden, um ihren Risikomanagementprozess zu veranschaulichen.
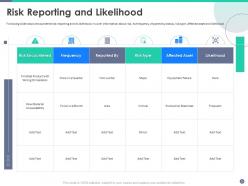
Folie 26 : Diese Folie stellt die Risikoberichterstattung und ihre Wahrscheinlichkeit dar.
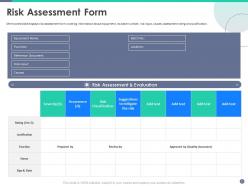
Folie 27 : Diese Folie zeigt ein Risikobewertungsformular mit Informationen über Ausrüstung, ihre Chargennummer, Risikoeingabe, Ursachen, Bewertungsbewertung und Begründung.
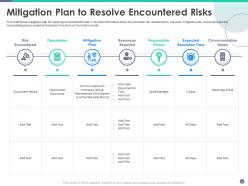
Folie 28 : Diese Folie stellt einen Risikominderungsplan zur Behebung einer aufgetretenen Bedrohung vor.
Folie 29 : Diese Folie zeigt das Inhaltsverzeichnis der Präsentation.
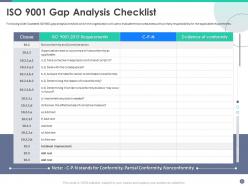
Folie 30 : Diese Folie zeigt eine Gap-Analyse-Checkliste, die die Organisation verwenden wird, um die Prozessbereiche mit der Hauptverantwortung für die anwendbaren Anforderungen zu bewerten.
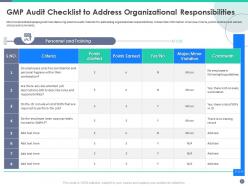
Folie 31 : Diese Folie stellt eine GMP-Audit-Checkliste zur Adressierung der organisatorischen Verantwortlichkeiten dar.
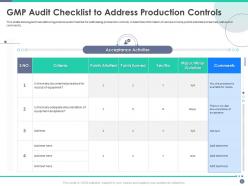
Folie 32 : Diese Folie zeigt eine Audit-Checkliste für gute Herstellungspraktiken für den Umgang mit Produktionskontrollen.
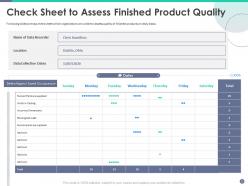
Folie 33 : Diese Folie zeigt ein Prüfblatt zur Beurteilung der Endproduktqualität.
Folie 34 : Diese Folie zeigt das Inhaltsverzeichnis der Präsentation.
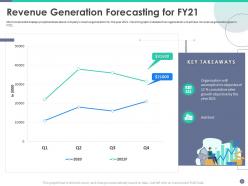
Folie 35 : Diese Folie zeigt prognostizierte Statistiken zur Umsatzgenerierung des Unternehmens für das Jahr 2021.
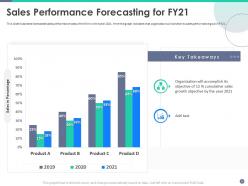
Folie 36 : Diese Folie veranschaulicht die prognostizierten Statistiken zur Verkaufsleistung des Unternehmens im Jahr 2021.
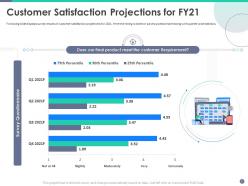
Folie 37 : Diese Folie zeigt die Umfrageergebnisse der Prognosen zur Kundenzufriedenheit für 2021.
Folie 38 : Diese Folie präsentiert das Inhaltsverzeichnis der Präsentation.
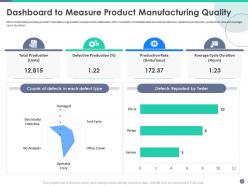
Folie 39 : Diese Folie zeigt das Dashboard zur Messung der Produktherstellungsqualität.
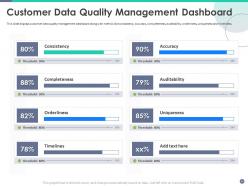
Folie 40 : Diese Folie zeigt das Dashboard für das Qualitätsmanagement von Kundendaten zusammen mit Metriken wie Konsistenz, Genauigkeit, Vollständigkeit usw.
Folie 41 : Diese Folie stellt die Symbole für die Qualitätskontrolle der Technik dar.
Folie 42 : Diese Folie trägt den Titel „Zusätzliche Folien“, um vorwärts zu gehen.
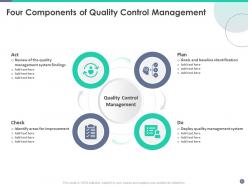
Folie 43 : Diese Folie stellt vier Komponenten des Qualitätskontrollmanagements vor.
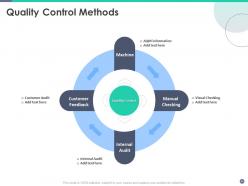
Folie 44 : Diese Folie zeigt Qualitätskontrollmethoden, die beschreiben – Qualitätskontrolle, Sichtprüfung, internes Audit usw.
Folie 45 : Dies ist eine Über uns-Folie, um Firmenspezifikationen usw. zu zeigen.
Folie 46 : Dies ist die Folie „Unsere Mission“ mit den dazugehörigen Bildern und Texten.
Folie 47 : Diese Folie zeigt Post-It-Notizen. Veröffentlichen Sie hier Ihre wichtigen Notizen.
Folie 48 : Diese Folie präsentiert das Kreisdiagramm mit zusätzlichen Textfeldern.
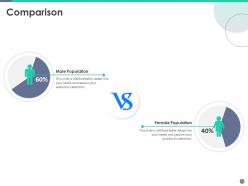
Folie 49 : Dies ist eine Vergleichsfolie zum Vergleich zwischen Waren, Einheiten usw.
Folie 50 : Diese Folie zeigt Puzzle mit zugehörigen Symbolen und Text.
Folie 51 : Diese Folie stellt Mind Map mit zugehörigen Bildern dar.
Folie 52 : Diese Folie zeigt das Venn-Diagramm mit Textfeldern.
Folie 53 : Dies ist eine Folie zur Ideengenerierung, um eine neue Idee vorzustellen oder Informationen, Spezifikationen usw. hervorzuheben.
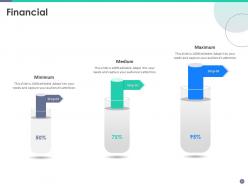
Folie 54 : Dies ist eine Finanzfolie. Zeigen Sie hier Ihre Finanzinformationen.
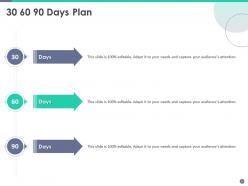
Folie 55 : Diese Folie zeigt einen 30-60-90-Tage-Plan mit Textfeldern an.
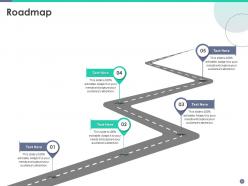
Folie 56 : Diese Folie stellt die Roadmap mit zusätzlichen Textfeldern dar.
Folie 57 : Dies ist eine Dankesfolie mit Adresse, Kontaktnummern und E-Mail-Adresse.
Qualitätskontrolltechnik Powerpoint-Präsentationsfolien mit allen 57 Folien:
Verwenden Sie unsere Powerpoint-Präsentationsfolien für die Qualitätskontrolle, um Ihre wertvolle Zeit effektiv zu sparen. Sie passen sich jeder Präsentationsstruktur an.



FAQs for Quality control engineering
Honestly, it's all about catching problems before they happen instead of playing whack-a-mole later. Way cheaper that route. Build quality right into your processes from day one. Document everything so you can actually repeat what works - I learned this the hard way at my last job. When something does go wrong, don't just slap a band-aid on it. Dig into the real cause. Statistical process control sounds boring but it's actually pretty useful for spotting when things start drifting off track. Map out your current workflow first and see where most defects happen. That's your goldmine right there.
Look, data collection is literally everything for QC - you can't fix what you can't see. Consistent measurements from inspections and tests help you catch problems before they blow up. Garbage in, garbage out, obviously. Your team needs solid collection methods they'll actually stick to (good luck with that part). Quality data lets you spot trends, predict when stuff's gonna fail, and back up your process changes when you're arguing with the boss. Oh, and definitely audit what you're collecting now - half of it's probably useless anyway.
Honestly, statistics are a game-changer for quality control. Control charts let you catch process drift way before it becomes a nightmare - they'll spot patterns you'd totally miss just eyeballing things. For sampling, you don't need to check every single part (thank god), just use statistical plans to hit the sweet spot. Root cause analysis gets so much faster with regression and hypothesis testing too. I'd start simple though - throw some SPC charts on your biggest headache processes first. Way better than the old "cross your fingers and hope" approach most places use.
So Six Sigma is this statistical approach for hunting down defects in processes - super useful in quality control. It follows this DMAIC thing (Define, Measure, Analyze, Improve, Control) to systematically fix quality problems. The target is 3.4 defects per million opportunities, which honestly sounds insane but actually works. Tools like control charts and root cause analysis become your daily bread and butter. Most QC engineers I've met swear by it. You should probably look into getting a Green Belt certification if you haven't already - makes a huge difference when you're troubleshooting quality issues.
Okay so first thing - grab your historical data from when everything was running smoothly and use that to set your baseline control limits. Then just plot your measurements over time and look for anything weird. Points outside the limits are obvious red flags, but also watch for trends or runs of data going the same direction. The real trick is getting everyone to actually stick with it (I swear, people love ignoring their own charts). Sample at regular intervals and when something looks off, jump on it right away. Don't be like my old team who'd collect tons of data then never act on it. Pick one critical parameter to start - you can always add more later once you've got the hang of it.
Dude, the main issues are teams being reactive instead of proactive, terrible documentation (or none at all), and zero consistency between departments. It's like playing whack-a-mole forever. What really gets me is how many places skip training people on QC procedures - I've seen this mess up entire projects. Fix it by creating clear SOPs that people actually use, not just file away. Do regular audits and cross-train your team so everyone's on the same page. Focus on preventing problems before they happen rather than catching them later. Oh, and track your prevention stats alongside defect rates.
Look, audits are basically your wake-up call - they show you where your actual processes differ from what you think you're doing. Yeah, they're annoying when you're swamped, but that's when you need them most honestly. You'll get real data on which problems keep showing up and what root causes you might've missed. The reports help you figure out what to tackle first instead of just winging it. I always tell people to track those findings over time - patterns emerge that you wouldn't notice day-to-day. Use them to prioritize your fixes by impact.
Look, ISO standards are basically your cheat sheet for quality control that actually works worldwide. Think ISO 9001 - it gives you frameworks that don't suck and saves you from figuring everything out yourself. You'll get systematic processes, proper documentation, plus that continuous improvement thing clients love. Honestly, the certification alone opens doors with picky clients who won't work with you otherwise. My old boss was obsessed with this stuff but he wasn't wrong - it really does give you credibility during audits. Just figure out which standards fit your industry first, then build your QC around those.
So instead of just fixing the same issues repeatedly, root cause analysis actually helps you find what's really causing problems. Use tools like 5 Whys or fishbone diagrams to trace defects back to their source. Way more effective than constantly putting out fires, trust me. Could be a process gap, broken equipment, or people need better training - but once you nail down the real issue, you can fix it for good. I'd start with whatever's happening most often and see how those fixes affect your quality numbers overall.
Honestly, AI is changing the game for quality control in some pretty wild ways. Computer vision can catch defects way faster than humans - I've seen it work and it's actually impressive. IoT sensors track everything in real-time across your production line. You can even use predictive analytics to spot problems before they blow up, which is huge for preventing costly mistakes. Digital twins let you test stuff virtually first. The statistical software has gotten crazy sophisticated too, and some companies are doing blockchain for supply chain tracking (though that feels a bit much to me). I'd say start with whatever's giving you the biggest headache and try one solution there.
So here's the thing - QC and risk management are basically joined at the hip. Every time you run FMEA analysis or check your control charts, you're really just asking "what's gonna break and how do I stop it?" I mean, your inspection protocols are literally risk prevention tools. The smart move is prioritizing which quality issues actually matter based on impact and probability. Like, don't waste time fixing tiny problems that won't hurt anything. Focus your QC budget on the stuff that'll actually save your butt if it goes sideways.
Look, supplier quality management is about catching problems before they hit your door instead of dealing with them later. Set clear standards upfront and audit your suppliers regularly - it's way cheaper than fixing stuff after the fact. Think of it like quality checkpoints throughout your supply chain. Your rework costs drop, products stay consistent, and honestly? Your supplier relationships get better too since you're working together on improvements. I'd start by figuring out which suppliers are most critical, then create scorecards to track how they're performing. Way less headache in the long run.
QC training is huge because you're basically the final checkpoint before stuff hits customers. Your team has to keep up with new standards and testing methods - regulations change constantly. Plus QC work gets mind-numbing, and people make mistakes when they're bored out of their minds. Cross-training saves your butt when someone calls in sick during crunch time. Fresh skills sessions keep everyone engaged. Don't skip the monthly refreshers or rotate duties around. Trust me, it's way cheaper than dealing with recalls later.
Look at support tickets and surveys to spot patterns in complaints - that's where the gold is. Most companies think they know what customers want but they're usually wrong. Sort feedback into categories so you can track trends over time. Fix the stuff that comes up most often first, obviously. But here's the thing people miss - you gotta circle back to customers after making changes. Let them know you actually listened. I've seen this turn angry customers into super loyal ones. The whole point is finding that gap between what you deliver and what people actually experience.
Track both your leading and lagging indicators to get the full picture. Defect rates, first-pass yield, and cost of poor quality are the basics. Customer complaint trends too - that one's obvious but people forget. Detection vs prevention costs is honestly my favorite metric because it shows exactly where you're wasting energy. Also watch cycle times for corrective actions, audit scores, and how your suppliers are performing. The key is mixing real-time process stuff with actual outcomes. Start with maybe 3-4 metrics that connect to your business goals, then add more once you've got decent data flowing.
-
Informative design.
-
Unique and attractive product design.
-
Graphics are very appealing to eyes.
-
Great experience, I would definitely use your services further.
-
Helpful product design for delivering presentation.
-
Very unique and reliable designs.
-
Innovative and attractive designs.
-
Easily Understandable slides.
-
Appreciate the research and its presentable format.