

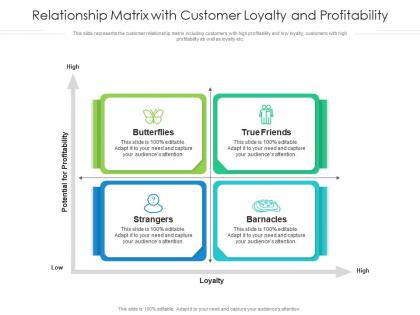
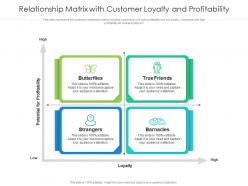
Relationship matrix with customer loyalty and profitability




Try Before you Buy Download Free Sample Product
 Impress Your
 Audience
 100%
100% Editable
 Save Hours
 of Time


Our Relationship Matrix With Customer Loyalty And Profitability are topically designed to provide an attractive backdrop to any subject. Use them to look like a presentation pro.
People who downloaded this PowerPoint presentation also viewed the following :
Relationship matrix with customer loyalty and profitability with all 2 slides:
Use our Relationship Matrix With Customer Loyalty And Profitability to effectively help you save your valuable time. They are readymade to fit into any presentation structure.
FAQs for Relationship matrix with customer
So basically you're looking at two things: how satisfied customers are vs how often they actually buy stuff. Plot everyone on those two axes and you'll get four different groups - like your ride-or-die loyal customers, people who might bail soon, or folks who had a great experience once but never came back (which is super common btw). Each group needs totally different approaches. The whole point is figuring out where to spend your time and money first. Honestly beats just randomly trying to keep everyone happy.
So here's what works: plot your customers on purchase frequency vs emotional attachment. Transaction data and repeat buys show frequency pretty easily. The emotional stuff? That's where NPS surveys and social media engagement come in - honestly way harder to measure but so much more telling. Once you map people into those four boxes (high/low frequency, high/low attachment), you'll spot who's actually loyal versus just buying out of habit. I'd test this with maybe 50-100 customers first before going all in.
So basically you've got two things to track - how happy customers are with your stuff, and how much they actually interact with your brand. Engagement is like purchase frequency, social media likes, support tickets, all that. When you plot both on a grid, you get four boxes. Top right corner? Those are your champions - super satisfied AND always engaging. Bottom left though... yikes, those customers are probably already shopping around. It's actually pretty useful for figuring out who needs your attention most versus who's already singing your praises.
So basically, you're grouping customers by how they actually behave, not just how much they spend. Most loyalty programs are pretty lazy - everyone gets the same "buy X, get Y free" deal. But with a matrix, you look at stuff like how often people buy, their lifetime value, engagement - then create different tiers. Way smarter approach, honestly. Each segment gets tailored strategies instead of generic rewards. The cool part? It's predictive rather than just transactional. You can spot who's about to churn or who might become a VIP. Start by plotting customers in quadrants based on spending and engagement patterns.
So basically you plot how often people buy vs how much they spend, and boom - you can spot your best customers visually. Top-right corner is where the magic happens - those are your frequent buyers who also drop serious cash. But here's the thing, don't sleep on the bottom-right folks either. They might shop rarely but when they do, they're buying expensive stuff (luxury buyers basically). Way better than staring at boring spreadsheets all day. Focus your retention stuff on these segments first and maybe hook them up with VIP perks.
Okay so the loyalty matrix thing is actually pretty smart - you split customers into four groups based on how much they buy and how engaged they are. Your big spenders who love you get the VIP stuff, obviously. But here's what's interesting: those customers who spend money but don't really engage? They're flight risks and need way more personal attention. Most companies totally blow this by using the same approach for everyone. Don't waste money on fancy outreach for your low-value people though - just automate that stuff. Map out where your customers sit this week and see which group is costing you the most.
Look, I'd track two things: how people actually buy and how they feel about you. Purchase-wise, check frequency, how recently they bought, how much they spend, and if they stick around. Then measure their emotional stuff - NPS scores, satisfaction ratings, how much they engage with your content. Customer lifetime value is solid too if your data's decent. Honestly, most people overthink this whole thing. These basics will tell you everything you need to know. You can always get fancier later, but start here and see what trends pop up first.
Dude, you can't just look at spend numbers alone. A 22-year-old dropping $50/month could be way more valuable than some boomer spending $200 - think lifetime potential, you know? Different age groups also have totally different dealbreakers. Millennials will bail if your mobile site sucks, but Gen X cares more about actual customer service. Income and location matter too for defining what "high value" even means. I'd layer 2-3 demographic filters over your RFM analysis first, otherwise you'll waste money trying to retain the wrong people. Trust me on this one.
Yeah, totally works across industries! You just gotta adjust what you're measuring. Like retail tracks purchase frequency and spending, SaaS looks at logins and feature usage. B2B is more about contract renewals and expansion revenue - makes sense since their sales cycles are way longer. The core idea stays the same though: "how often do they engage" and "how much value do they bring." Those become your two axes. Just pick metrics that actually matter for your business model instead of random vanity numbers that look good but don't tell you anything useful.
Don't treat your customer matrix like gospel - people's buying habits shift all the time, so refresh those segments regularly. Teams waste tons of money trying to push every customer into that "loyal" box when some folks just aren't worth the effort, tbh. Using stale data or too few touchpoints will mess you up too. Oh, and avoid going crazy with like 15 micro-segments because you'll lose your mind managing campaigns. Keep it simple with 4-6 solid groups and actually try different approaches for each. Test what works instead of guessing.
Honestly, I'd do it quarterly - every three months. Customer stuff changes so fast these days, like what worked in January might be completely wrong by July. After major campaigns or product launches, definitely refresh it too. I learned this the hard way when I kept using old data and couldn't figure out why nothing was working anymore. Some companies I know update twice a year minimum, but quarterly is better if you can swing it. Just set a calendar reminder now or you'll forget. Trust me, stale customer data is worse than no data sometimes.
Okay so basically you're grouping customers by how much they buy and engage with your stuff. Then you can actually send them things they care about instead of random promotions nobody wants. Your best customers get VIP treatment, people who haven't bought in forever get "we miss you" emails - that kind of thing. Some people want early access to new products, others just want discounts (honestly most people just want discounts lol). You'll figure out where to spend your marketing budget too. Just map out your current customers first and you'll start seeing the patterns pretty quickly.
Set up feedback collection at the right moments - post-purchase surveys, NPS after support calls, quarterly check-ins with your best customers. Map what people say directly to your matrix segments so you can actually spot trends. Most companies I've seen just hoard feedback without doing anything useful with it, which is honestly such a waste. Build loops where insights automatically update your matrix - like bumping someone from "at risk" to "engaged" when their sentiment improves. This way your matrix stays current instead of being stuck on old purchase data.
Honestly, just start with Excel or Google Sheets if you're new to this - they work fine for basic customer segmentation. Tableau and Power BI are where it's at for bigger datasets though, plus their charts actually look professional. If your company's got serious money to spend, tools like Mixpanel or Amplitude are built specifically for customer analytics (though Salesforce can be kind of a pain to set up). The main thing is connecting whatever you choose to your CRM and sales data. Oh, and don't overthink it at first - you can always upgrade later when things get complicated.
So basically, loyalty matrix data shows you exactly what's making customers tick - and where your products are missing the mark. Start with high-spenders who don't stick around. They're clearly finding gaps in what you're offering. Low-spenders who love you? Those people probably want premium stuff but you're not giving them options. I mean, it's pretty much a cheat sheet for product fixes. The matrix breaks down which groups need what - better features, different prices, whatever. Focus on your biggest money-makers first though.
-
Unique and attractive product design.
-
Easily Understandable slides.
-
I discovered this website through a google search, the services matched my needs perfectly and the pricing was very reasonable. I was thrilled with the product and the customer service. I will definitely use their slides again for my presentations and recommend them to other colleagues.
-
Best way of representation of the topic.