


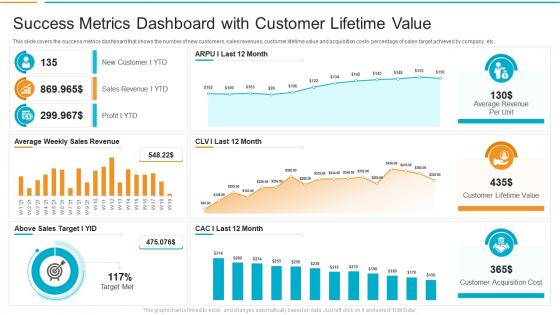
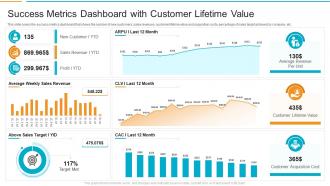
Success metrics dashboard with customer lifetime value




Try Before you Buy Download Free Sample Product
 Impress Your
 Audience
 100%
100% Editable
 Save Hours
 of Time


Our Success Metrics Dashboard With Customer Lifetime Value are topically designed to provide an attractive backdrop to any subject. Use them to look like a presentation pro.
People who downloaded this PowerPoint presentation also viewed the following :
Success metrics dashboard with customer lifetime value with all 2 slides:
Use our Success Metrics Dashboard With Customer Lifetime Value to effectively help you save your valuable time. They are readymade to fit into any presentation structure.
FAQs for Success metrics dashboard with
For your CLV dashboard, I'd go with five main things. Average order value, purchase frequency, and customer lifespan give you the basic CLV calculation. Then tack on acquisition cost and churn rate so you can see if you're actually making money. Cohort analysis is pretty clutch too - shows how different customer groups act over time. Oh, and revenue per segment helps with targeting. Honestly, the main thing is don't overcomplicate it. You want to spot trends quickly and figure out where to put your retention energy without getting lost in a million numbers.
Start by grouping customers based on how they actually behave - purchase frequency, order size, how long they've been around. For each group, calculate CLV using: (average purchase × frequency × margin) × customer lifespan. Your high-value segments will need fancier modeling, obviously. I'd begin with maybe 3-4 basic buckets like new customers, loyal ones, and those at-risk of churning. Track everything in your dashboard and don't be afraid to tweak segments when you spot new patterns. Honestly, you'll learn way more once you see which factors actually move the needle on lifetime value. Then get more specific from there.
Dude, visualizing your CLV data is a game changer. Those spreadsheet numbers become way clearer when you turn them into actual charts and graphs. You'll instantly see which customer groups are worth the most and spot trends you'd totally miss otherwise. Trust me, trying to make sense of CLV without visuals is brutal - like navigating with coordinates instead of a real map. The patterns just pop when you can see cohort breakdowns and churn rates visually. Start with basic bar charts by segment. I bet something interesting will jump out right away. Actually made this mistake myself early on - wish I'd started with visuals sooner.
Honestly? Monthly updates are your best bet, though weekly works if you're not swamped. Customer habits change fast these days - like, overnight sometimes in digital stuff. Monthly gives you solid trends without drowning in daily chaos. I've watched teams obsess over daily numbers and it's honestly exhausting for everyone involved. You don't want to constantly flip your strategy every time something dips. Short bursts work better, some longer stretches too. Just set a calendar reminder and actually stick to it - that's the hardest part tbh.
For CLV dashboards, I'd probably go with Tableau, Power BI, or Looker. Tableau's amazing for custom visualizations but takes forever to learn properly. Power BI is actually decent now if you're using other Microsoft stuff - they've really stepped up their game. Your data team might prefer Looker since it's more technical and lets them build custom models from scratch. Google Data Studio works too for basic setups, though you'll get frustrated with complex CLV calculations pretty fast. Honestly? Just pick whatever plays nice with your existing data setup first.
So predictive analytics is pretty cool - it takes your old customer data and uses machine learning to find patterns you'd miss otherwise. Like seasonal stuff, how often people buy, when they're about to bail. Way better than just looking at past spending to guess future value. These algorithms are honestly getting crazy good at juggling tons of variables at once - engagement, support issues, payment habits, all that. Makes your CLV forecasts way more solid for planning budgets. Oh and you'll need at least 12-18 months of clean data to really see it work properly.
Honestly, data quality is your biggest enemy here. Different systems never want to cooperate - customer IDs won't match across platforms, you'll have missing transactions everywhere. Multi-channel attribution? Good luck with that mess. Also, nobody ever agrees on what "lifetime" actually means for the business (learned that one the hard way). Getting stakeholders aligned on methodology is like herding cats. The technical side gets nasty too since real-time processing isn't exactly straightforward. My take? Start with a simple pilot using your cleanest historical data first. Prove it works, then add the complicated stuff later.
Honestly, CLV data is gold for figuring out which customers are worth fighting for. Start with high-value customers who aren't engaging as much lately - those are your must-saves. Your dashboard will show which marketing channels bring the stickiest people (game-changer for budget planning). From there, you can build targeted campaigns or tweak service levels based on what each segment's actually worth. Oh, and definitely pull reports on your top 20% first. See what retention stuff they respond to best, then scale from there.
CLV shows you where your marketing dollars actually matter. Focus bigger budgets on high-value customer segments - they'll pay off way more long-term. I used to spread money everywhere like peanut butter, but targeting the right people changes everything. Sure, you might pay more upfront for quality customers, but it's worth it. Low-value segments? Give them cheaper tactics instead. Your dashboard breaks down which segments are goldmines, so check it quarterly and shift your spend accordingly. Game changer once you get the hang of it.
So your CLV dashboard is gold for figuring out which customer segments to actually go after. Point your sales team toward prospects that look like your best customers - saves everyone time. What's wild is seeing which products actually drive the most lifetime value (it's never what you think). Train your reps to push those high-value offerings during calls. Oh, and this is key: restructure commissions around predicted CLV instead of just deal size. Otherwise you'll keep getting quantity over quality. Trust me, it changes everything about how your team sells.
So basically, CLV vs CAC tells you if you're making money or just burning cash on customers. You want CLV to be at least 3x your CAC - think spending $100 to make $300+ back over time. Anything lower and you're screwed. This ratio shows which marketing channels actually work and which ones are trash. I'd check it monthly because trends shift fast. Like, you might think Facebook ads are killing it but then realize you're barely breaking even. Short sentences work here. Adjust your spending before you run out of runway.
Break down your CLV dashboard by how customers actually behave - stuff like how often they buy, what categories they go for, which channels they prefer. You'll notice patterns pretty quick. Maybe all your big spenders use the mobile app, or they always grab specific product bundles together. Once you spot those trends, find customers with lower value who are starting to show the same behaviors. That's your upsell goldmine right there. Oh, and set up alerts when people hit those high-value behavior markers - honestly saves so much time vs manually checking everything.
Okay so three main things - first, break down your CLV by customer segments instead of showing one massive average. Executives eat up that high-value vs at-risk stuff. Second, stick to simple visuals like bar charts. Complex graphs just confuse people honestly. Always include the "so what" part too - like what revenue impact you're projecting or what actions to take next. Show trends over time, not just static snapshots. Oh and this is huge - tailor it to who's looking. C-suite wants the big picture insights while marketing teams need all the tactical details broken down.
So basically the dashboard stops those annoying meetings where marketing and sales are arguing over completely different numbers. Your customer success team can actually see that Account X is worth 50K over three years instead of just winging it. Finance finally gets why you're burning cash on certain channels, and product can figure out which features people actually stick around for. Honestly, the monthly cross-team reviews are kind of a pain to set up but they're worth it - forces everyone to quit talking past each other.
So CLV data shows you which customer segments are actually worth your time and money. Focus on features that keep those high-value users happy. When your best customers start asking for specific stuff or using certain features more, pay attention - that's pure gold for planning what to build next. You can also spot opportunities to bump lower-value segments up to the next tier. Honestly, most companies are terrible at connecting CLV trends to what users actually do in their product. But if you nail that connection in your dashboard, you'll know exactly where to spend your dev resources.
-
Topic best represented with attractive design.
-
Nice and innovative design.
-
Very unique, user-friendly presentation interface.