

Sample Presentation For Thesis Powerpoint Presentation Slides





Try Before you Buy Download Free Sample Product
 Impress Your
 Audience
 100%
100% Editable
 Save Hours
 of Time


A reader should be able to easily identify the thesis of any business plan. For this purpose, our team of dedicated designers have created this sample presentation for thesis PPT template which can showcase your thesis statement in a professional and attractive manner. Merge this professionally designed sample presentation for thesis PowerPoint slideshow with your presentation and experience a high-quality performance that will leave an everlasting impact on your viewers. This sample presentation for thesis presentation deck has a set of various pre-made PPT slides representing important fundamentals such as literature review, purpose statement, hypothesis, statistical analysis, etc. A thesis statement should be easily identifiable by a reader and should be clear and not ambiguous. Choose our thesis presentation ppt and design beautiful PPT slides based on the summary of your presentation and why the presentation is worth taking a look. So, download now and incorporate our amazing slide shows into your business presentations. Be accepted as an effective captain with our Sample Presentation For Thesis Powerpoint Presentation Slides. Establish yourself at the helm.
People who downloaded this PowerPoint presentation also viewed the following :
Content of this Powerpoint Presentation
After months of hard work, there comes a time when you have to compile your research findings in a single presentation, what we call a ‘thesis.’ It will include the purpose of your research, the data or insights you gathered, and the process of research you used.
Presenting your original research work in a structured manner is a daunting experience, and we totally understand it. In the solution, ready-to-use thesis templates can streamline your presentation through stunning design and organized layout. Check out our research proposal slides to communicate your findings in a professional manner.
This blog is all about sample presentation for thesis PPT wherein you will get 33 editable slides to showcase your hypothesis, literature review, statistical analysis, and much more. After getting done with your research, we know that you have a lot of information to present, which is why Slideteam’s thesis templates have focused slides and data visualizations. It can comprehend your proposal professionally.
Let us head straight to the brief of the top 10 slides which you might find useful.
Template 1: Your Title Project
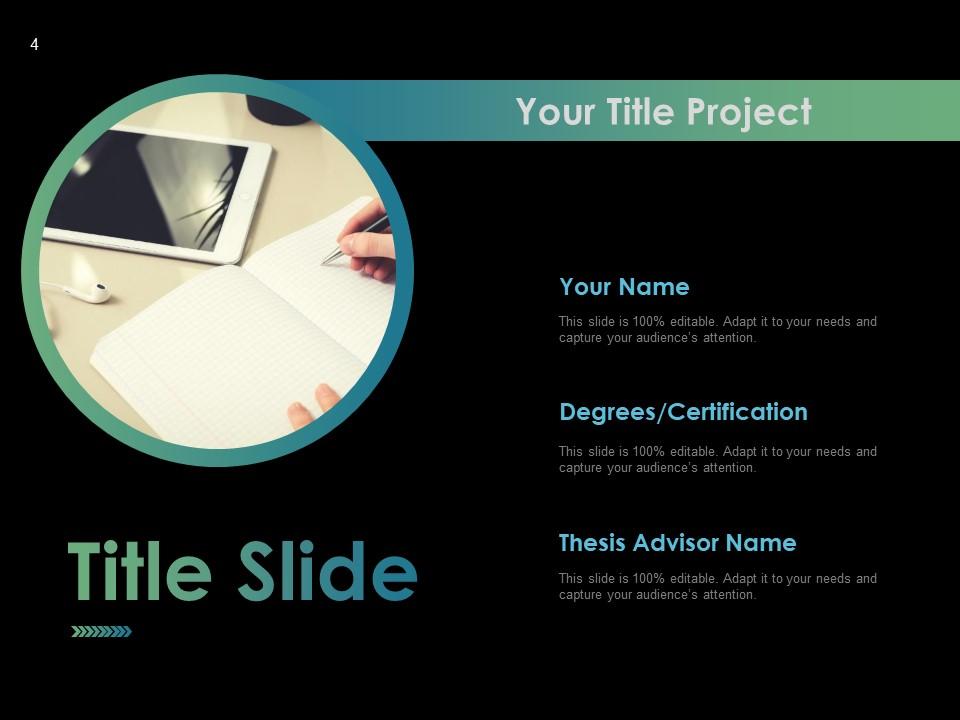
This slide is essential for your thesis presentation. It can mention your thesis title, along with your name, degrees, and thesis advisor's name. The slide design is quite professional and successfully piques the audience's attention. It will also show your preparedness and attention to detail regarding the topic and give context to the people to whom you are going to talk about your research.
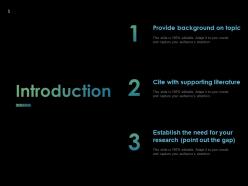
Template 2: Introduction
Introduction is the starting point of a presentation, and we need to make sure we set it right. This template will do justice to your comprehensive research, as you can present your introductory ideas effortlessly. You can communicate the aims of the presentation and outline the objectives to draw the audience's attention. By using this template, you can set the tone for the presentation and proceed with the help of literature to develop authenticity.
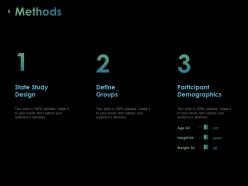
Template 3: Methods

While doing research, you might have used different research methods to gather insights on the topic. It is time to highlight those methods, and this slide will systematically define your study design, groups, and participant demographics to develop credibility. You can justify your methodology and state how rigorously you have conducted each experiment, which will depict the validity of your findings. Plus, you can demonstrate your expertise and professionalism, which shows your credibility as a researcher.
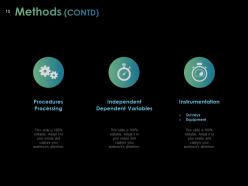
Template 4: Methods (CONTD)
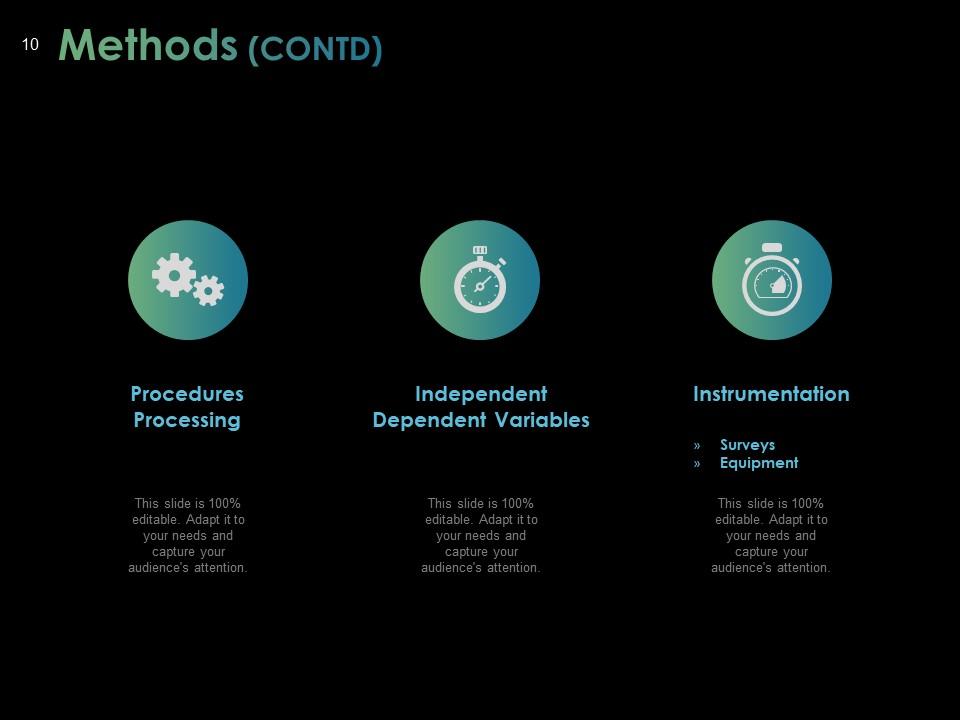
This is another method template that describes the procedure processing, independent dependent variable, and instrumentation. You can outline your research methodology along with data and facts, which creates a sense of transparency in replicating the desired information. This template, when used correctly, can facilitate a well-structured discussion, enabling you to make informed decisions about the study's implications.
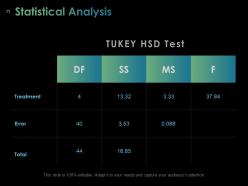
Template 5: Statistical Analysis
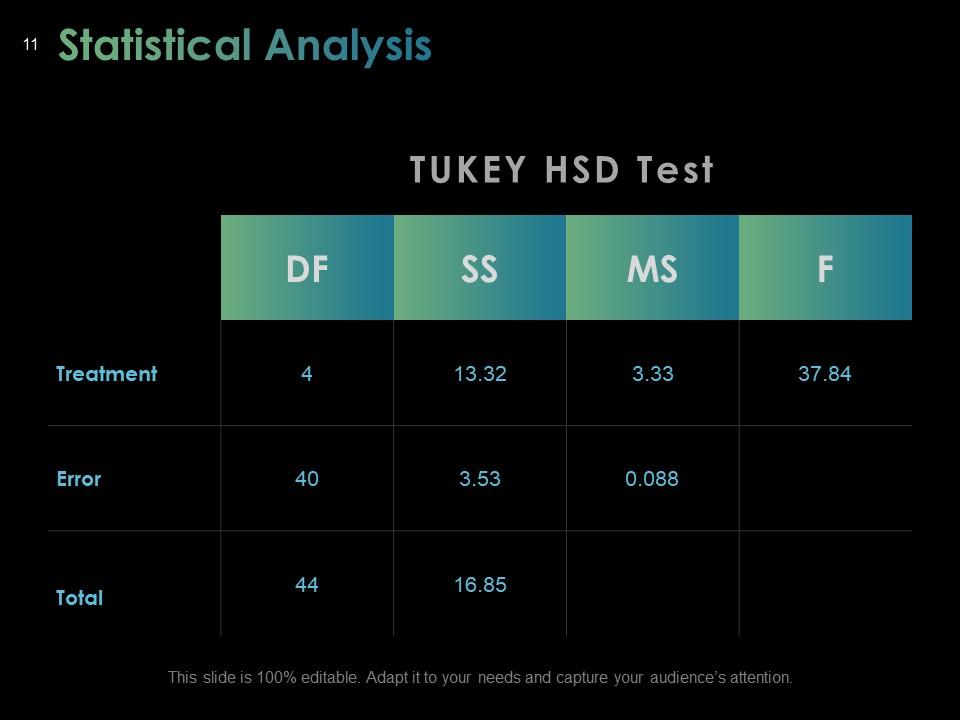
This slide will elucidate the statistical data through the analysis of data and derive meaningful results from it. From this, the audience will get the methodology transparency as it will implicate the soundness of the research when data is shown in numbers. Plus, the audience will know the key patterns and trends in data identified in the analysis. After that, a comparison of variables can be made to quantify the magnitude of the research findings.
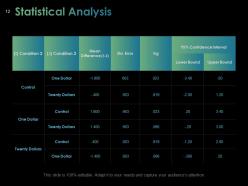
Template 6: Statistical Analysis
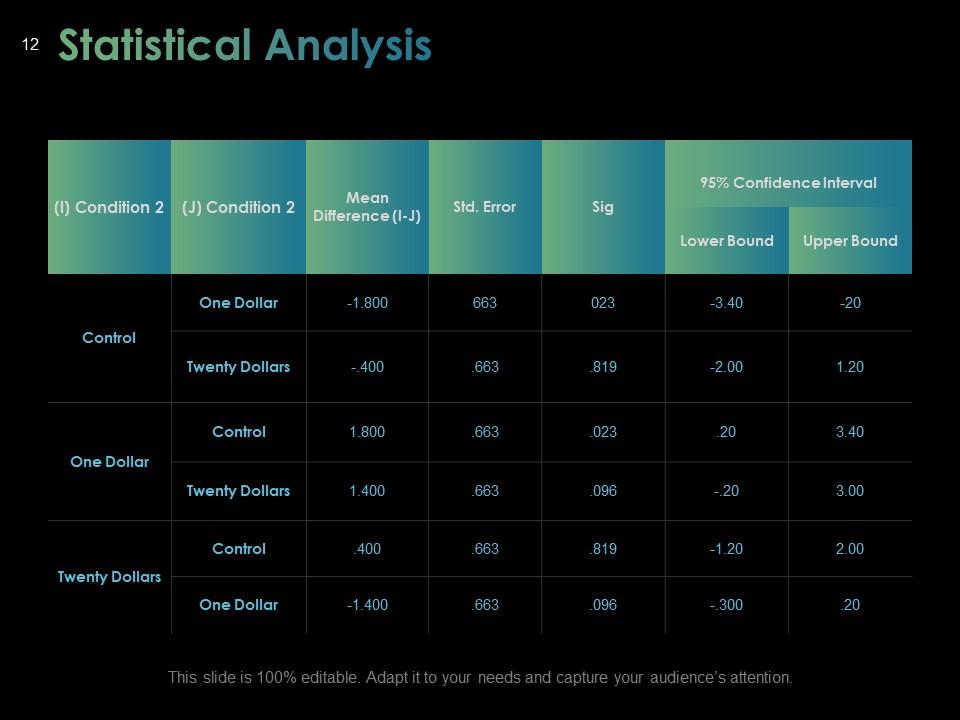
This is another statistical analysis template with an enchanting theme. Use this template to compare data facts through various observational tools. You can examine the probability of given figures along with the determination of significant relationships amongst the different datasets. It will depict your capacity to elaborate on the findings in a professional and attention-to-detail manner. Your proficiency in quantitative methods can also be expressed for better insight generation.
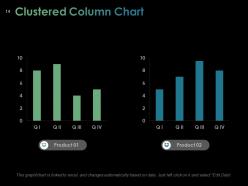
Template 7: Clustered Column Chart
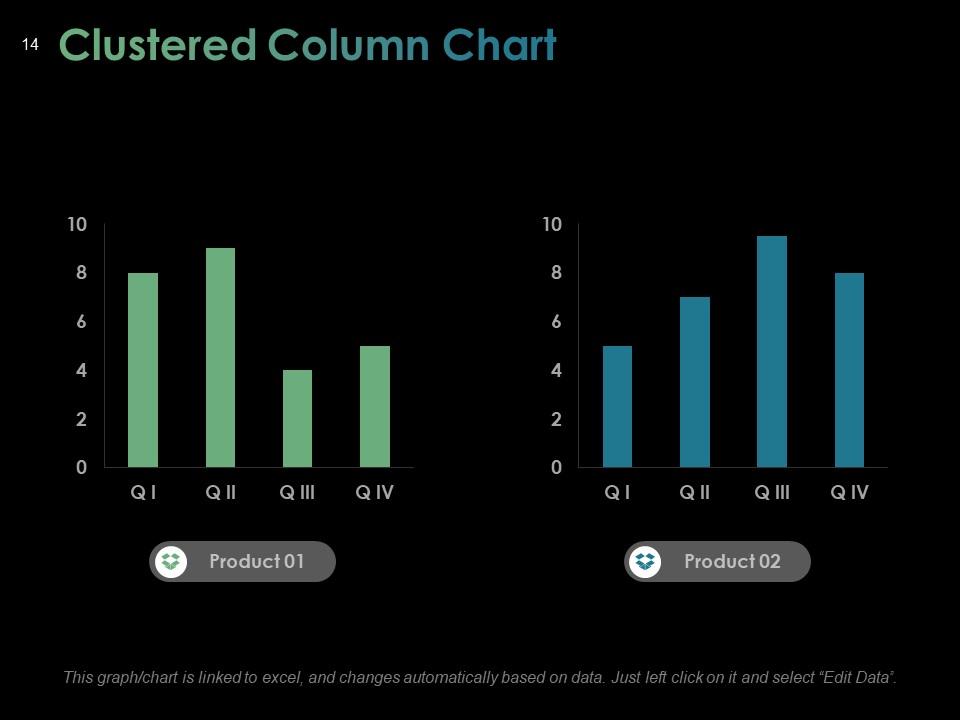
This template will visualize your data patterns in a clustered column chart. You can import data from the Excel sheet and edit it as you need. You can compare multiple categories or groups in a streamlined manner, making data representation easy. Use this PPT slide to create a visual impact on the audience. The distinct colors in the columns will draw the attention of the people to the important points.
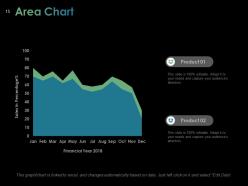
Template 8: Area Chart
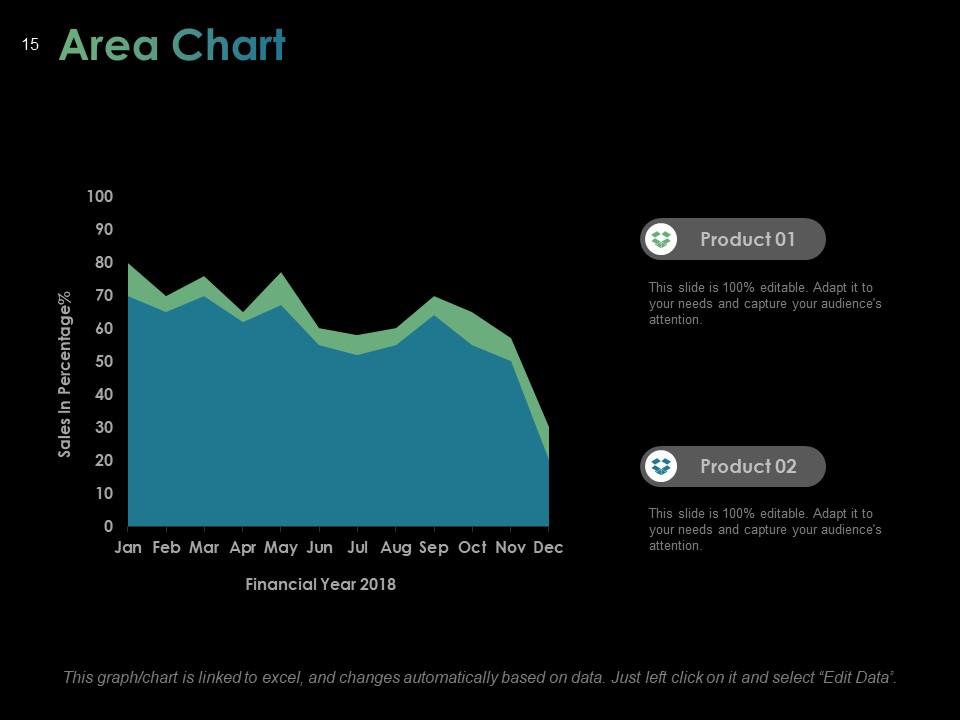
When it comes to describing data, you always choose the best tool. Here comes the area chart slide where you can compare your dataset across different product categories. You can identify trends and also analyze fluctuations and relationships between the variables to embrace the understanding of data. Area charts can simplify complex information in a simpler manner, making the audience grasp the information at a glance.
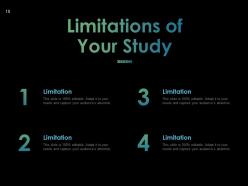
Template 9: Limitations of Your Study
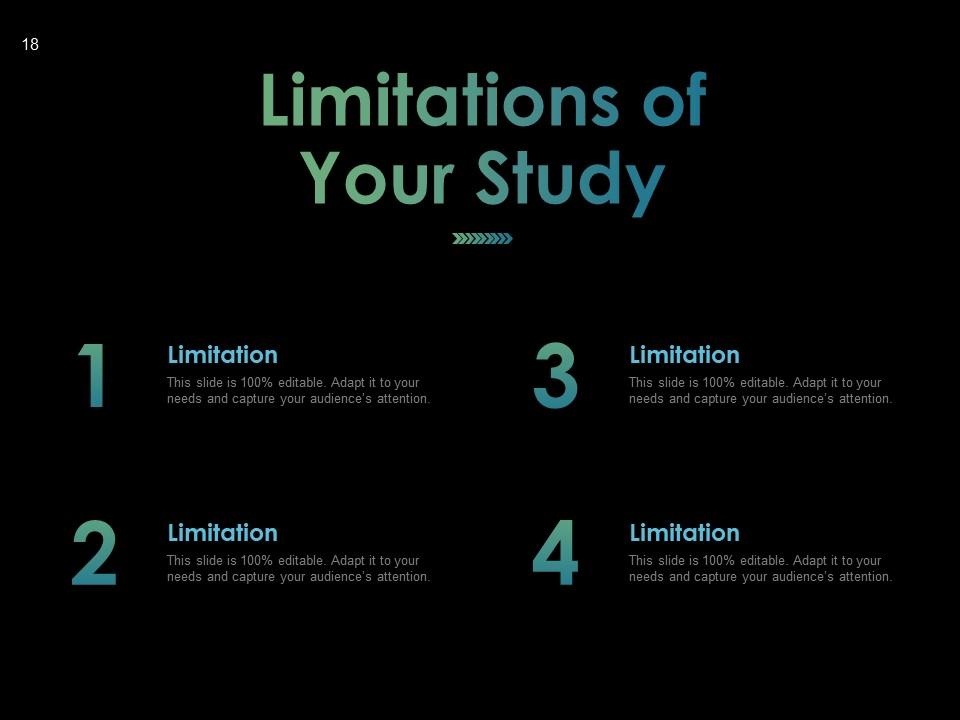
This slide can specify the limitations of your study in a flow that you can dictate one by one when you are giving a presentation. It depicts the researcher's transparency in accurately addressing potential shortcomings. By including this important slide, you can manage the audience's expectations and also prevent misinterpretations of the research findings. It will describe that your study is ethically conducted with a balanced view of strengths and limitations.
Template 10: Conclusion/ Findings
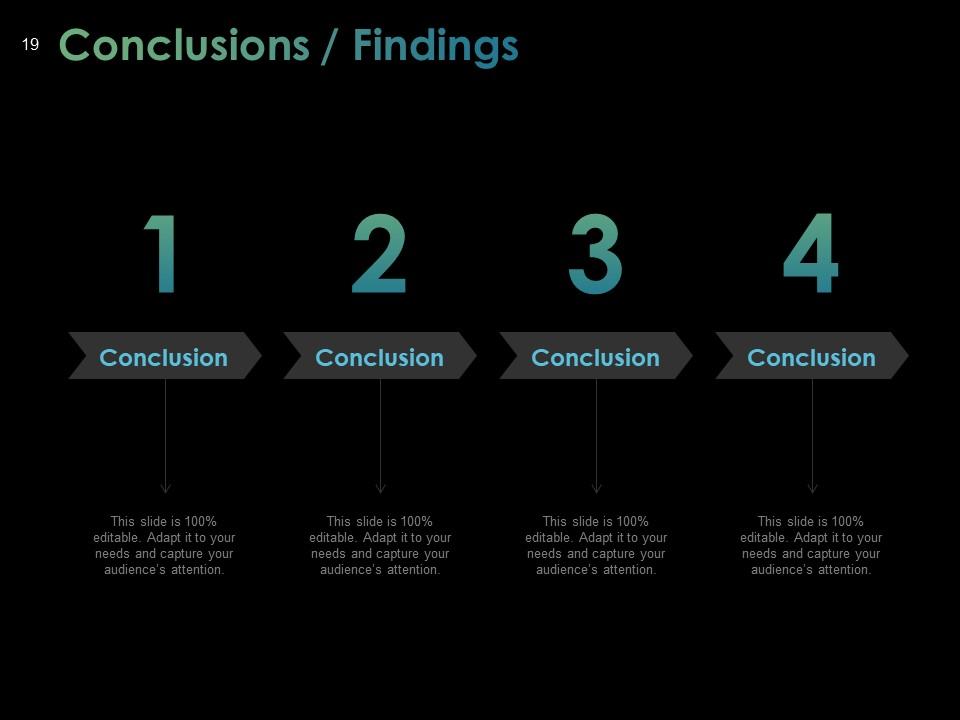
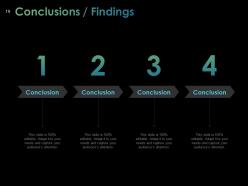
Use this slide to assimilate the key findings of your study in a simple and digestible format. The presenter can clearly highlight the major achievements of the research and also keep the reader in touch with the main message. It will provide closure to the journey by stating contributions and recommendations for providing practical implications of the study. Through this template, you can take confidence in the main findings and demonstrate that you are able to communicate the same to the audience.
Show Off Your Innovative Research with Analytical Presentations
Explaining your research work is something that can keep you overwhelmed, especially when you do not have the right tools to make your work streamlined.
With the use of these thesis presentation templates, you can structure your presentation smoothly with decluttered slides. The fact that each slide is 100% editable makes your presentation seem personalized, as you are just putting in your data, and the content-ready PPT already does the rest of the work. So get yourself prepared with your story and share your research journey professionally with us!
Sample Presentation For Thesis Powerpoint Presentation Slides with all 33 slides:
Build a good impression as a candidate with our Sample Presentation For Thesis Powerpoint Presentation Slides. Enhance the chances of getting elected.






FAQs for Sample Presentation For Thesis
So for your thesis presentation, you'll want the obvious stuff: title slide, research question, lit review summary, methodology, findings, implications, and conclusions. Honestly the methodology part always feels like the most boring section but whatever. Build in some transition slides between the big sections - it helps people follow along. Oh and definitely do a "questions" slide at the end. Practice with your actual template beforehand so you're not fumbling around. Aim for about one slide per minute, so maybe 15-20 minutes total. I'm getting nervous just thinking about those presentations again!
Oh definitely use visuals! Charts and graphs make complex data way easier to digest. I've watched some really solid research presentations completely bomb because they were just endless text slides - it's painful. Diagrams can show your methodology better than trying to explain it all verbally too. Plus your committee's brains need visual breaks from processing all that dense info. Photos, screenshots, simple infographics - they all help reinforce your main points. Just don't throw in random pretty pictures though. Each visual should actually do something useful for your argument.
Honestly, focus on telling a story with your slides. Problem first, then how you tackled it, what you found, and why it matters. Visual stuff works way better than walls of text - trust me on this one. You'll want at least one slide that really shows off your best finding, something that makes people go "oh damn." Oh and throw in some transition slides between big sections so people don't get lost. Practice your timing too because you don't want to rush through everything. Maybe a minute per slide? But some will be faster, some slower obviously.
Honestly, just pick your top 3 findings and hit people with why they should care right off the bat. Don't get bogged down explaining your methods unless they specifically ask - nobody really wants to hear about that part anyway. I like to pretend I'm just telling a friend about it over drinks. Let your charts and visuals do most of the work when the data gets messy. Practice how you'll move between points so you don't end up rambling (I'm terrible at this). After each finding, give them one punchy sentence about what it actually means. Trust me, they'll forget all the nitty-gritty details but remember the big picture stuff.
Look, you don't want people zoning out during your thesis defense - that's just painful for everyone. Eye contact is huge. Ask questions, throw in a poll if you can, whatever keeps them awake. The best presentations feel like conversations, not lectures. I always try to connect my research to stuff people actually care about in real life (makes a difference, trust me). Read the room though - if they look confused, slow down and break things down more. Engaged audiences ask better questions and actually remember what you said afterward.
Know your crowd first - stalk their LinkedIn if you have to lol. Academics want the deep stuff: methodology, how it connects to existing research, all those theoretical details. Industry people? They care about real-world impact and practical solutions. Skip the jargon with them. Mixed audiences are honestly the worst but manageable. I'd prep different versions of your main slides so you can switch on the fly. Practice explaining your big idea both ways - academic speak and normal human language. That way you won't panic if the room isn't what you expected.
Don't read straight off your slides - that's the worst thing you can do. Practice your timing with someone first, trust me on this one. Your slides should just have key points, not paragraphs of text. Oh and face your audience! I've seen so many people turn around and talk to their slides instead. The Q&A afterwards is usually where people freak out most, so think through potential questions beforehand. Your committee wants to see you actually understand your work, not just memorize a script. Body language matters way more than you'd expect too.
So basically, think of your thesis like telling a story. Start with something that grabs people - like a real situation that shows why anyone should care about your research. Then walk them through it like a story: here's the problem (your research question), here's what I did to figure it out (methodology), and here's what I discovered. Structure it with a beginning, middle, end instead of just dumping data on them. I swear this works way better than boring bullet points - people actually stay awake! Maybe run through it with someone first to see if it makes sense.
Take your time with each question - seriously, the pause won't kill you. When you're stumped, just say "good question, I'd have to dig deeper into that" instead of bullshitting (they'll catch you instantly). Thank them for feedback and scribble notes even if you think they're wrong. Most questions come from genuine interest, not some gotcha attempt. Keep answers short and sweet, then loop back to your main results. Oh, and definitely do a practice round with your advisor first - anticipate the scary questions beforehand. You've got this!
Dude, less is more with slides. Go big on fonts - 24pt minimum or people will squint. High-quality images work way better than walls of text. I swear, nothing's worse than watching someone just read their slides out loud for 20 minutes. One idea per slide, keep your colors bold so the back row can actually see stuff. Oh and definitely test it on their projector first if you can - sometimes colors look totally different. Your slides should back up what you're saying, not BE what you're saying. Consistent formatting throughout and you're golden.
Honestly, just go with PowerPoint or Google Slides - they work and won't crash on you mid-presentation. Canva's actually pretty sweet if you want something that looks professional without spending hours on design (their academic templates are legit). If you're into coding, LaTeX with Beamer gives you perfect formatting, especially for math stuff. Prezi's kinda cool with the zooming thing, but it might be too flashy for professors. My roommate used it once and the committee seemed... confused? Anyway, don't overthink it. Your research is what matters, not whether you have fancy animations.
Dude, your color scheme will totally make or break this thing. Go dark text on light backgrounds - trust me, those gradient backgrounds are not it. For fonts, stick with something clean like Arial or Calibri, nothing fancy. Make your text at least 24pt because the people in back need to actually read it too. High contrast is clutch. Oh and definitely test it on the actual projector first! I learned this the hard way - colors look completely different on the big screen than your laptop. Had slides that looked great on my computer but were basically unreadable projected.
Honestly, record yourself doing sections and watch it back - you'll spot weird habits you never realized you had. Get friends or coworkers to watch and give real feedback about pacing. I used to speed through complicated parts when I got nervous, but going slower actually helps people keep up. Oh, and try explaining your whole thesis in like 2 minutes first, then build out from there. Practice standing up since that's probably how you'll present. The transitions between sections are huge - practice those so you don't blank out halfway through and just stand there awkwardly.
Honestly, the best presentations I've seen use tech to back up their points, not show off. Clean slides with charts or key quotes work way better than walls of text nobody reads anyway. Videos are clutch for demonstrating stuff or showing real examples. But here's the thing - I've watched people get so caught up in flashy animations that it totally kills their momentum. Keep it simple, test everything twice (trust me on this), and have a backup ready because Murphy's Law loves thesis presentations. Your research should be the star, not your PowerPoint skills.
Okay so definitely practice out loud a bunch - like until you can do the main parts without even looking at your notes. You'll want to know your stuff so well that nerves can't throw you off completely. Here's the thing though - your committee actually wants you to pass! They're not there to destroy you or anything. Oh and if you get asked something you don't know? Just be honest and say "great question, I'd have to dig into that more." Don't try to BS your way through it. Take deep breaths between sections too.
-
Good