


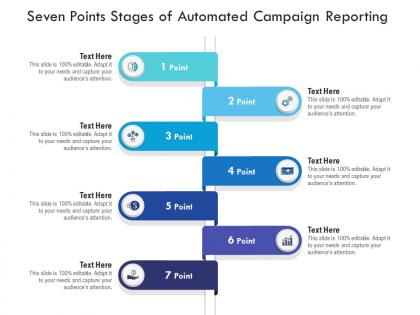
Seven points stages of automated campaign reporting infographic template




Try Before you Buy Download Free Sample Product
 Impress Your
 Audience
 100%
100% Editable
 Save Hours
 of Time


Our Seven Points Stages Of Automated Campaign Reporting Infographic Template are topically designed to provide an attractive backdrop to any subject. Use them to look like a presentation pro.
People who downloaded this PowerPoint presentation also viewed the following :
Seven points stages of automated campaign reporting infographic template with all 2 slides:
Use our Seven Points Stages Of Automated Campaign Reporting Infographic Template to effectively help you save your valuable time. They are readymade to fit into any presentation structure.
FAQs for Seven points stages of automated campaign
So you'll need four main things: real-time data from all your channels, dashboards that don't suck (most are terrible btw), alerts when stuff breaks, and automatic reports. Honestly, people always screw up the dashboard part - they track literally everything instead of what actually moves the needle. Pull data from your ad platforms, email stuff, social media, whatever you're running. Set up alerts so you catch problems before they tank your budget. Oh and start with just one channel first, then add more. Way easier than trying to do everything at once.
Dude, automated reporting is a game changer. You'll save hours every week not pulling data from like five different platforms manually. Real-time dashboards just update themselves, so you can actually catch bad campaigns before they eat your budget alive. Honestly, I used to hate doing those weekly reports - such a pain. Now I can focus on actual strategy instead of being stuck in spreadsheets forever. Your boss gets consistent updates without you panicking Sunday night trying to throw everything together. Start with whatever report takes you the longest each week.
Honestly, start with the conversion stuff - CTR, conversion rate, cost per acquisition. That's what actually matters. Revenue and ROAS are no-brainers since your boss will ask about those first anyway. I always check engagement metrics too like time on site and bounce rate because they show if your traffic is garbage or not. Skip vanity metrics like impressions unless you're doing brand awareness (which is boring but whatever). Set up alerts when anything tanks below your benchmarks. You'll catch problems way faster that way and can fix them before things get messy.
Dude, you'll never have to deal with typos in spreadsheets again. Automation pulls data the exact same way every single time - no more "oh shit, did I grab last month's numbers?" moments. Honestly, manual reporting is the worst, especially when you're rushing to finish something on a Friday afternoon and copying stuff between platforms. Your data just flows straight from the source into clean reports automatically. Set it up once and you're done - no more wondering if someone messed up a formula or pulled the wrong date range. It's such a relief.
Google Analytics is probably your best bet to start - most people already have it running anyway. HubSpot and Salesforce both do automated reports pretty well too. If you want something more flexible, check out Supermetrics or Klipfolio. Honestly? Sometimes I just use Google Sheets with API connections when I'm feeling lazy. For social stuff specifically, Hootsuite makes life way easier. You could even get scrappy with Excel if budget's tight. I'd just start with whatever you're already using for campaigns, then add more tools if you need fancier charts or want to pull data from multiple platforms.
Dude, automated reporting is seriously worth it. You catch problems right when they happen instead of finding out a week later that you blew your budget. Real-time alerts save my ass constantly - like when an ad suddenly tanks or goes crazy expensive. Way better than those nightmare Excel sheets we used to deal with. Just don't get obsessed with follower counts and other fluff metrics, you know? Focus on dashboards that track what actually makes you money. I check mine every morning with coffee - sounds nerdy but it prevents disasters.
Honestly, the worst thing you can do is automate everything right off the bat. I've watched people drown their stakeholders in like 20 useless vanity metrics that nobody asked for or cares about. Super annoying for everyone involved. Clean your data sources first - automating garbage data is still garbage. Don't build reports without knowing your actual KPIs either. Test everything before it goes live because broken automations are embarrassing. Just pick 3-5 metrics that actually matter to your business goals. Get those working smoothly, then add more later.
Honestly, I'd go with daily reports for the first week - you'll catch problems way faster that way. Weekly is fine once everything's stable, but monthly? That's asking for trouble. I learned this the hard way lol. High-spend stuff or new audiences though? Keep checking daily so you can bail if needed. Really depends on how much risk you're comfortable with. Oh and your budget obviously - bigger spend means you should probably be watching closer. Start paranoid with frequent checks, then relax once you trust it's working.
Honestly, automated reporting is a game-changer because it stops that whole telephone game thing between teams. Sales can actually see which campaigns brought in leads and how they're converting without bothering marketing every five minutes. Marketing gets to see what actually closes too, which is huge for figuring out what works. Everyone's looking at the same dashboard instead of having those weird meetings where nobody agrees on the numbers - you know the ones I'm talking about. Just give both teams access to the same reporting tool and watch the drama disappear.
Start with encrypting everything - data in transit and at rest. Then set up access controls so only the right people see specific reports. The compliance stuff (GDPR/CCPA) feels like a nightmare at first, but honestly it's just about being methodical. Audit trails are crucial - you'll need to track who accessed what and when. Oh, and anonymize personal data in reports whenever you can. Here's what I'd do: run a compliance audit on your current setup before adding more automation. Way better to find the gaps now than get hit with issues later.
Dude, automated reporting is a game changer for ROI stuff. You get data instantly instead of waiting forever for manual reports. I can't tell you how many times I've watched people burn through budgets before realizing their campaigns were tanking. Real-time alerts let you pivot fast when something's not working. The consistency is huge too - you're actually comparing the same metrics across campaigns instead of guessing. You'll spot which channels drive real conversions way faster. Honestly, just set up threshold alerts so you know immediately when performance drops. It's saved my butt more times than I can count.
So basically these tools turn all your messy campaign data into actual charts and graphs you can understand at a glance. Way better than drowning in spreadsheets - I mean, who has patience for that anymore? You'll catch performance trends super quick and spot which channels are crushing it. Google Data Studio's pretty solid for this, or Tableau if you want something fancier. The reports update automatically too which is nice. Your boss will actually look at these instead of pretending they don't exist. Just start simple though - pick your main KPIs and build one dashboard first.
So ML is gonna make your campaign reports way smarter - like, predicting which campaigns will bomb before they actually do instead of just showing last week's numbers. The cool part? It'll automatically spot weird patterns and suggest fixes based on what's worked before. I'm honestly pretty pumped about where this is heading. Oh, and make sure your data collection isn't a mess right now because these systems need clean info to actually help you out.
Honestly, just think about what each group actually cares about. Executives want the big picture stuff - ROI, conversion rates, keep it simple. Marketing teams are data nerds though, so give them everything: click-through rates, audience breakdowns, A/B test results. Sales folks? They want lead scores and pipeline numbers. Most platforms let you build different dashboards for each team - you pick the metrics, timing, all that. But here's the thing - actually ask them what decisions they're making with this data first. Otherwise you'll end up sending reports nobody reads.
Definitely do hands-on workshops where everyone clicks through reports together - so much better than just talking about it. Regular "report review" sessions work great too, people can ask questions and share which metrics they're actually finding useful. Oh, and make some simple cheat sheets or quick videos for the workflows your team uses most. Honestly the magic happens when they can jump right into their real campaigns instead of fake practice stuff. I'd pair newbies with your experienced people for a few weeks. Trust me, having someone you can bug with random questions makes all the difference.
-
The Designed Graphic are very professional and classic.
-
Excellent products for quick understanding.
-
Great designs, really helpful.
-
Qualitative and comprehensive slides.
-
Design layout is very impressive.
-
Awesome presentation, really professional and easy to edit.
-
Unique design & color.
-
Top Quality presentations that are easily editable.
-
Appreciate the research and its presentable format.