


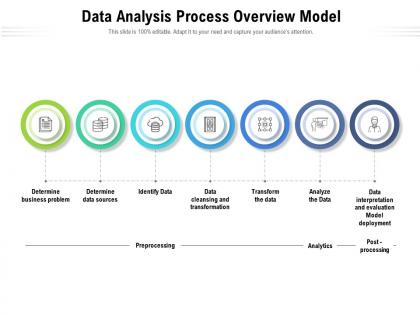
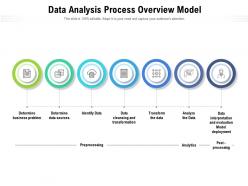
Data analysis process overview model




Try Before you Buy Download Free Sample Product
 Impress Your
 Audience
 100%
100% Editable
 Save Hours
 of Time


Our Data Analysis Process Overview Model are topically designed to provide an attractive backdrop to any subject. Use them to look like a presentation pro.
People who downloaded this PowerPoint presentation also viewed the following :
Data analysis process overview model with all 2 slides:
Use our Data Analysis Process Overview Model to effectively help you save your valuable time. They are readymade to fit into any presentation structure.
FAQs for Data analysis
So you basically start with collecting your data, then comes the worst part - cleaning and preprocessing everything. Such a pain but you gotta do it. Next is exploring the data to see what you're actually dealing with. Then you do your modeling or stats analysis, interpret what it all means, and finally make some visualizations to show people. But honestly? It's never that clean. You'll be doing your analysis and suddenly realize your data's still messy, so back to cleaning you go. Or you'll finish a model and think "wait, this makes no sense" and have to try something totally different. Just document everything so you don't lose track when you inevitably have to circle back.
Dude, data cleaning is SO important - like, it'll literally make or break everything you're doing. Messy data means garbage results, period. Doesn't matter how fancy your analysis gets afterward. I've watched entire teams waste weeks building these elaborate models, only to find out their original data was completely screwed up from day one. Talk about a nightmare. Clean data lets you actually trust what you're finding and spot real patterns instead of just random noise. Honestly, just bite the bullet and spend the time cleaning upfront. You'll thank yourself later when you're not presenting totally bogus conclusions to your boss.
Honestly, **Tableau** and **Power BI** are solid choices if you want something that looks professional and can handle messy datasets. Clients eat up those interactive dashboards. I'm always reaching for **Python with matplotlib/seaborn** when I'm just poking around data - super fast to test ideas. **R's ggplot2** makes beautiful charts but yeah, there's definitely a learning curve there. Don't sleep on Excel though! Sometimes you just need a quick chart to see what's going on. My advice? Start with whatever your team already uses, then figure out upgrades later based on budget and what you actually need.
Okay so first figure out what decision you're actually trying to make, then work backwards from there. Your goals need to be super specific - like "cut customer churn by 15%" instead of something vague like "understand customers better." Been there, done that mistake lol. Define your success metrics right upfront and be realistic about timelines based on your data quality. Write it all down and get everyone to agree on it beforehand. Seriously, scope creep will destroy your project otherwise and you'll thank yourself later for having that documentation.
Okay so first thing - set up automated tests right when data comes in. Use checksums to catch corruption during processing. Version control is a lifesaver, trust me on this one. I learned that the hard way lol. Build audit trails that track every transformation and who touched what. Run consistency checks between your raw vs processed stuff. Oh and don't try adding this stuff later - bake it into your workflow from the start or you'll hate yourself. Begin with simple validation rules then expand as you go.
So EDA is when you're just poking around your data without any real plan - looking for weird stuff, patterns, whatever jumps out. Think detective work but messier. Confirmatory analysis is the opposite though. You already have a theory and you're testing whether it's actually true or just wishful thinking. I always start with EDA because honestly, data surprises you more than you'd expect. Then once you find something interesting, that's when you switch gears and do the formal statistical tests to see if your hunch holds up.
First thing - check where your data's coming from and how you collected it. Demographics missing? Weird time periods? That stuff can totally mess with your results. Get other people to look at your work too, because honestly, we all have blind spots we can't see ourselves. Document everything so someone else can catch what you missed. Try cross-validation or control groups if you can swing it. Oh, and don't forget stratified sampling - that one's clutch. Always be upfront about limitations when you present findings. Multiple interpretations exist for most data, so don't get married to your first conclusion.
Think of statistical modeling as turning your data into something you can actually act on. It finds patterns and helps predict what'll happen next - way better than just looking at charts of old stuff. You can test ideas, figure out how different things connect, and get a sense of how confident you should be in your results. Linear regression is probably your best starting point (though honestly the math behind it used to confuse the hell out of me). Once you get comfortable with that, you can tackle more complex models depending on what you're trying to solve.
Look, nobody wants to stare at spreadsheets all day. When you turn your data into an actual story, people remember it. Start with the problem, walk through what you found, then hit them with the "so what?" Don't just dump charts on them - be like a detective revealing clues one by one. Your audience needs to understand why these numbers matter to *their* world. Honestly, I've seen so many presentations die because they skipped this step. Next time, structure it as "here's what happened, here's what we discovered, and here's what you should do about it."
Dude, write everything down as you go - I'm not kidding, you'll hate yourself later if you don't. Keep track of your methods, where you got the data, cleaning steps, all that stuff. When you find something interesting, don't just note what it was but why it actually matters. Three months ago I had to redo this whole analysis because I was lazy about documentation... never again. Timestamp everything, use headers that make sense, and honestly? Write like someone else might need to understand your mess. Version your code too and explain the big decisions you made.
Dude, the metrics you pick literally shape your entire story. Pick the wrong ones and you're screwed - I learned this the hard way when I was obsessing over page views while my actual engagement was trash. Users were bouncing instantly but I thought everything was amazing lol. It's like wearing the wrong prescription glasses - everything looks distorted. Short bursts of traffic don't mean much if people hate your content. Before you start crunching numbers, just double-check that you're actually measuring what matters for your goal. Otherwise you'll waste weeks chasing the wrong wins.
Honestly, the consent and privacy stuff is huge - only use data people actually said yes to sharing, and strip out anything that could identify specific people. Bias is sneaky too. I've seen so many analyses where sampling bias or algorithmic bias screws over certain groups, and you don't even realize it's happening when you're buried in spreadsheets. Always ask yourself who wins and who gets hurt from your findings. Document everything so people can call you out if needed. Oh, and be upfront about where your data sucks or your methods fall short.
Think of stakeholder feedback as your reality check - they'll catch when you're missing key context or chasing the wrong numbers. I swear, it's so easy to get tunnel vision when you're buried in spreadsheets all day. They know the business side you might not see and can tell you if your findings actually match what's happening in real life. Don't wait until you're done to ask them either - that's a rookie mistake. Get their input early when you're still exploring. Way better than presenting something that's technically perfect but totally misses the mark.
Ugh, the biggest pain is that messy data doesn't play nice with normal database stuff. Like, how do you query a meme or someone's random tweet? You'll need fancy tools for text analysis and image recognition, which honestly gets expensive fast. Cleaning everything takes forever too since there's zero consistency. I'd say pick one type first - maybe just text or just images - and figure that out before going crazy with everything. Way less overwhelming that way. Trust me, I tried doing it all at once and wanted to throw my laptop out the window.
Check data quality first - sample sizes, how they collected it, how recent it is. Prioritize whatever's most reliable for your specific thing. This detective work is honestly kind of fun once you get into it! Look at whether the source actually knows their stuff in that area. Does their method make sense for what you're doing? If you're stuck between datasets, just run your analysis on both and see if you get wildly different results. Oh, and document your choices - you'll hate yourself later when someone asks why you picked that source and you can't remember.
-
Unique design & color.
-
Illustrative design with editable content. Exceptional value for money. Highly pleased with the product.
-
Enough space for editing and adding your own content.
-
Very well designed and informative templates.
-
Colors used are bright and distinctive.
-
Visually stunning presentation, love the content.
-
Use of different colors is good. It's simple and attractive.
-
Graphics are very appealing to eyes.
-
Very well designed and informative templates.
-
Qualitative and comprehensive slides.