
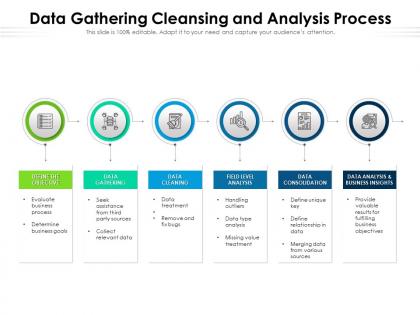
Data gathering cleansing and analysis process


Try Before you Buy Download Free Sample Product
 Impress Your
 Audience
Editable
of Time


Our Data Gathering Cleansing And Analysis Process are topically designed to provide an attractive backdrop to any subject. Use them to look like a presentation pro.
People who downloaded this PowerPoint presentation also viewed the following :
Data gathering cleansing and analysis process with all 2 slides:
Use our Data Gathering Cleansing And Analysis Process to effectively help you save your valuable time. They are readymade to fit into any presentation structure.

FAQs for Data gathering cleansing
So there's three main types. Descriptive analytics just shows you what already happened - like your basic reports and dashboards. Pretty straightforward stuff. Predictive tries to forecast what's coming next by looking at patterns. Then prescriptive actually tells you what to do about it, which honestly is the coolest part. Think of descriptive as looking backwards, predictive as looking forward. Most companies start with the basic descriptive stuff first, then get fancier. I'd just figure out what questions you're trying to answer right now and pick whichever one fits. Don't overthink it.
Dude, seriously - charts and graphs will save your presentation. People absorb visual info like 60x faster than text, which is crazy when you think about it. Your audience won't have to squint at boring spreadsheets trying to figure out what's going on. Bar charts and line graphs instantly show trends and weird outliers. Even super basic visuals crush data tables every time. Plus your stakeholders will actually remember the important stuff instead of zoning out. I always think of it as telling a story rather than just throwing numbers at people. Trust me, start simple and you'll see the difference right away.
Python and SQL are where I'd start - they're super versatile and you'll use them everywhere. Python's amazing for cleaning data and machine learning with pandas/scikit-learn. SQL is just mandatory for database stuff, no way around it. R is fantastic if you're doing heavy stats work (statisticians swear by it), plus the visualizations look really good. Oh, and Tableau's great for making dashboards that actually impress executives - though honestly, it's pricey. I'd probably skip Tableau initially unless you're presenting to non-tech people regularly. Start with Python/SQL, then see what else you need.
Honestly, build those quality checks right into your pipeline from day one. Trust me on this - I've wasted way too many hours debugging weird results that could've been caught early. Set up automated rules for missing data, duplicates, all that fun stuff. Document where your data's coming from so you can actually trace things back when stuff goes sideways (and it will). Regular audits help catch problems before they snowball. Oh, and don't let this be just IT's headache - make it everyone's job. Way easier to prevent data disasters than fix them later.
Honestly, three things will probably trip you up: crappy data, everyone adding random requests, and people not agreeing on what you're even trying to do. Spend time cleaning your data first - I learned this the hard way when my whole analysis fell apart because of garbage inputs. People will keep asking for "just one more thing" during meetings (it's so annoying), so write down your goals upfront and don't budge. Also make sure everyone actually agrees on what "success" means before you start. Document stuff and check in regularly. Trust me on this one.
Big data is totally changing analytics - we're talking massive amounts of info coming from everywhere at crazy speeds. Traditional tools just can't keep up anymore. Real-time processing and machine learning are becoming must-haves now. Cloud platforms are where it's at since they can actually handle the scale. The cool part? We can finally analyze messy stuff like social media posts and IoT data, not just spreadsheets. Predictive analytics that don't suck, automated insights - it's pretty wild. My advice? Get familiar with cloud platforms first. ML basics wouldn't hurt either, though that learning curve is steep.
Honestly, start thinking about consent and privacy right from the beginning - don't wait until later. Only grab data people actually said yes to sharing, and anonymize personal stuff properly. Biased datasets are a nightmare because they create biased results that can genuinely harm people. Just because you *can* track every little thing someone does online doesn't mean you should (seriously, some of that behavioral stuff is borderline creepy). Be upfront about your methods and what went wrong when you share results. Oh, and here's my litmus test - would you be cool if someone ran this same analysis on your personal data?
So ML basically takes your regular data analysis and puts it on steroids. You know how you spend hours looking for patterns? It automates all that tedious stuff and finds connections you'd never spot - like weird customer behaviors or random correlations between things. Honestly, some of the patterns it catches are pretty wild. Plus you can automate the boring repetitive analysis, which gives you more time for actual strategy work. My advice? Don't go crazy at first. Just pick one thing you're already analyzing and test if ML can do it better or faster.
ROI is where I'd start - just track revenue from your analytics projects against what you spent. Pretty straightforward math there. Time-to-insight matters too (how fast can you actually get useful data), plus data quality and whether people on your team are even using this stuff. So many companies obsess over vanity metrics though, it's ridiculous. What actually counts? Decision accuracy - are you making smarter choices because of your data? Track how often insights get implemented, not just created. Start with these basics, then get fancier as you figure out what works.
So data analytics is basically turning messy raw data into actual useful insights for business decisions. Healthcare companies analyze patient records to improve treatments and cut costs. Amazon's scary-good recommendations? That's retailers using analytics to optimize inventory and personalize marketing. Banks need it for risk assessment and catching fraud - manufacturers use it to predict when machines will break down. Oh, and streamline operations too. The trick is starting with clean data and knowing what questions to ask. My advice? Pick one specific problem you're trying to solve first.
Dude, storytelling is everything in data analytics. Without it, you're just throwing charts at people and watching them zone out completely. I learned this the hard way in my first job - presented all these amazing insights and got blank stares back. Your data needs a story arc: here's the problem we faced, here's what we found (like solving a mystery together), and here's exactly what you should do about it. Don't just dump statistics. Walk them through it with context first. Then hit them with findings that actually matter to their world. End with clear actions they can take tomorrow.
Real-time analytics lets you spot trends and react way faster than competitors. Dynamic pricing, inventory tweaks, catching customer problems early - that stuff matters. But here's the thing - you need dashboards that actually drive decisions, not just look impressive in meetings. Uber and Amazon basically crushed it this way. Start small though. Pick one area where speed really impacts your customers. Get that data flowing first, then expand from there. The magic happens when you're making calls in hours instead of waiting weeks. That's where you'll actually see the difference.
Put your big findings right at the top - don't bury the lead. Executive summary first, then get into your methods and results. Charts should be dead simple to read because people will zone out otherwise. I do this thing where I ask "so what?" about every slide to make sure it's not just filler. Oh, and consistent formatting matters more than you'd think. Practice out loud beforehand because someone will definitely ask you to cut the data seventeen different ways. Skip the jargon unless you're talking to other data nerds. Trust me on this one.
Honestly, start by getting data in front of everyone - not just your analytics nerds. Train people on basic stuff so they're not terrified of dashboards. Your execs need to actually use data in meetings too, otherwise nobody takes it seriously. Way too many companies dump expensive tools on people then wonder why nothing changes (classic mistake). Set up regular sessions where teams can show off cool insights they found. Give people actual time to dig around instead of always going with their gut. Oh, and celebrate when someone makes a solid data-backed call that pays off.
Real-time analytics is where it's at right now. AI/ML automated insights are blowing up too - plus this thing called augmented analytics that lets regular people dig into data without being total nerds about it. Edge computing's making everything faster. Privacy stuff is massive with all these new regulations. Honestly, companies still running week-old reports look pretty dated compared to the ones making decisions in real-time. You should probably start some small pilots in these areas soon. Even baby steps beat sitting on the sidelines while your competitors figure it out first.
-
Very unique, user-friendly presentation interface.
-
Innovative and Colorful designs.
-
Professional and unique presentations.
-
Professional and unique presentations.
-
Use of different colors is good. It's simple and attractive.