


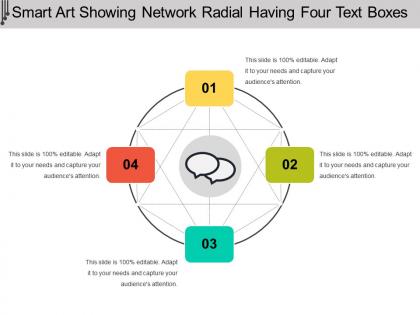
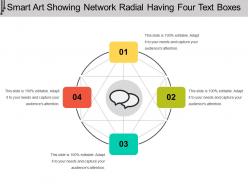
Smart art showing network radial having four text boxes




Try Before you Buy Download Free Sample Product
 Impress Your
 Audience
 100%
100% Editable
 Save Hours
 of Time


Create channels of communication with our Smart Art Showing Network Radial Having Four Text Boxes. Encourage them to express effectively.
People who downloaded this PowerPoint presentation also viewed the following :
Smart art showing network radial having four text boxes with all 5 slides:
Our Smart Art Showing Network Radial Having Four Text Boxes give ideas a chance to flourish. They ensure a great abode.
FAQs for Smart art showing network radial having
SmartArt Network Radial layouts offer enhanced visual hierarchy, simplified complex relationships, improved audience comprehension, flexible customization options, and professional aesthetic appeal. These designs streamline information presentation by centralizing core concepts while radiating supporting elements outward, with many presenters finding that radial structures ultimately deliver clearer messaging and stronger audience engagement across business communications.
SmartArt Network Radial effectively represents complex data by positioning central concepts at the hub with related elements radiating outward, creating intuitive hierarchical relationships that highlight dependencies, connections, and data flows. This visual approach streamlines comprehension of intricate datasets, organizational structures, and process workflows, with many analysts and project managers finding that radial layouts enhance stakeholder understanding while delivering clearer decision-making insights.
Best practices for customizing SmartArt Network Radial include adjusting color schemes to match brand palettes, modifying fonts to align with corporate typography, resizing elements for optimal hierarchy, and incorporating brand-specific icons or symbols. These customizations enhance visual consistency across presentations, strengthen brand recognition, and create more professional deliverables, with many organizations finding that branded SmartArt significantly improves audience engagement and reinforces corporate identity.
SmartArt Network Radial excels in business presentations for organizational charts, project workflows, and stakeholder mapping, while also proving valuable in educational settings for concept relationships, system diagrams, and process flows. This visual format streamlines complex information presentation by creating clear hierarchical structures, enabling faster comprehension, and ultimately delivering enhanced audience engagement across corporate training, strategic planning, and academic instruction scenarios.
SmartArt Network Radial transforms static bullet points into dynamic visual relationships, showing how central concepts connect to supporting elements through intuitive circular layouts that guide audience attention naturally. This visual storytelling approach helps presenters in consulting, strategy, and training sessions deliver complex interconnected ideas more effectively, with audiences finding the radial format easier to follow and remember than traditional linear lists.
SmartArt Network Radial seamlessly integrates with various presentation styles through consistent color schemes, typography alignment, and strategic placement alongside charts, infographics, and data visualizations. This integration enhances overall presentation coherence by maintaining visual hierarchy, complementing slide templates, and supporting storytelling flow, with many presenters finding that combining radial networks with timeline graphics and process diagrams ultimately delivers more engaging, comprehensive presentations.
Microsoft PowerPoint, Visio, and Word include built-in SmartArt Network Radial tools, while Lucidchart, Canva, and Google Slides offer similar radial diagram capabilities. These platforms streamline network visualization by providing pre-designed templates, drag-and-drop functionality, and customization options, with many organizations finding that integrated Office suite tools deliver seamless collaboration and professional presentation outcomes.
Presenters can effectively narrate SmartArt Network Radial diagrams by starting with the central concept, then systematically explaining each connected element's relationship to the core and to each other. This approach enables audiences to visualize complex interconnections, process hierarchies, and system dependencies more clearly, with many business professionals finding that radial storytelling enhances comprehension and retention significantly.
Common mistakes when creating SmartArt Network Radial include overcrowding the central hub, using inconsistent visual hierarchy, poor color contrast, and unclear relationship indicators between elements. These design pitfalls undermine communication effectiveness by creating confusion rather than clarity, with many organizations finding that streamlined layouts, strategic color schemes, and balanced element distribution ultimately deliver stronger visual impact and enhanced audience comprehension.
**INPUT**: What are some real-world examples of successful presentations using SmartArt Network Radial? **OUTPUT**: SmartArt Network Radial proves highly effective in organizational charts, customer journey mapping, product ecosystem presentations, and IT infrastructure overviews across various industries. Companies like consulting firms, technology startups, and healthcare organizations leverage this format to showcase interconnected systems, stakeholder relationships, and process flows, ultimately delivering clearer communication and enhanced audience comprehension.
Effectiveness of SmartArt Network Radial can be measured through audience feedback surveys, engagement metrics during Q&A sessions, comprehension assessments, and follow-up discussions about key connections presented. These measurement approaches enable presenters to evaluate visual clarity, information retention, and decision-making outcomes, with many organizations finding that structured radial diagrams significantly enhance stakeholder understanding and accelerate project approvals.
Over-relying on SmartArt Network Radial can create visual monotony, reduce audience engagement, and oversimplify complex relationships that require more detailed explanation or alternative visualization methods. While these diagrams streamline information presentation, organizations risk losing narrative depth and failing to address diverse learning preferences, with many finding that strategic rotation between multiple visual formats ultimately delivers stronger comprehension and sustained audience interest.
Cultural differences significantly influence radial diagram interpretation through varying reading patterns, hierarchical expectations, color symbolism, and spatial relationships. While Western audiences typically read clockwise from top-right, Middle Eastern and Asian cultures may interpret differently, with collectivist societies potentially viewing central elements as community-focused rather than authoritative, ultimately requiring presenters to adapt designs for global audiences and ensure consistent message delivery.
SmartArt Network Radial offers customizable color schemes, hierarchical node arrangements, dynamic resizing capabilities, animation sequences, and clickable pathway navigation for interactive presentations. These features enable presenters to guide audiences through complex organizational structures, process flows, and relationship mappings while maintaining visual clarity, with many finding that the radial format enhances audience engagement and comprehension.
SmartArt Network Radial enables educators to visually represent complex concepts by placing central ideas at the core with related elements radiating outward, making abstract relationships clear and memorable. Through this radial structure, teachers enhance comprehension in subjects like biology for ecosystem relationships, history for cause-and-effect patterns, and literature for character connections, ultimately delivering improved retention and deeper analytical thinking among students.
-
Informative design.
-
Great product with highly impressive and engaging designs.