


Technical support flow chart for customer service




Try Before you Buy Download Free Sample Product
 Impress Your
 Audience
 100%
100% Editable
 Save Hours
 of Time


Our Technical Support Flow Chart For Customer Service are topically designed to provide an attractive backdrop to any subject. Use them to look like a presentation pro.
People who downloaded this PowerPoint presentation also viewed the following :
Content of this Powerpoint Presentation
A technical support flowchart is a technique that helps in finding solutions with computers and similar devices. It outlines the steps in sequence, when seeking technology assistance. The idea is to be clear on the issue plaguing your systems and hunt for ideas and solutions.
If failure results, you dig deep and conduct more research to reach the root of the problem and the optimum action that will resolve it. Additional information is solicited, if necessary.
Next, you apply advanced solutions. If successful, great; otherwise, if all else fails, you escalate the matter to an experienced professional. The technology support flowchart guides you through each step, facilitating issue resolution and prompt restoration of functionality.
Navigate seamless technical support collaboration with our cross-functional flow chart. Download now & deliver.
Flowcharts greatly enhance business development by smoothing problem-solving processes. They lead to easy, quick and efficient identification and resolution of technical problems. For the end-user, this is nothing but more productivity and reduced downtime. With clear outlines of all steps, technical experts can troubleshoot issues effectively without further delays. This flowchart leads to better operations and customer experience is also taken to another level, resolving concerns in a prompt manner. With the clear recording of optimum solutions within the flowcharts, corporations can build a knowledge base for future needs. Employees are also empowered to find independent solutions. Overall, technology support flowcharts lead to the happy situation of few disruptions.
Optimize your technical assessment process with our concise 4-phase flow chart. Click here to download & get started!
SlideTeam PowerPoint Templates, each of which is 100% edible and customizable, provide you with an effective way to showcase key aspects related to your topic. Our technology-support flowchart presentation designs help you highlight actions, such as identifying issues, finding solutions, and managing escalations. Using these PPT layouts, you can amplify messages related to IT support, troubleshooting, and customer satisfaction among your audience. These PowerPoint visuals also help you to highlight the value of problem-solving in sectors like IT services, software development, and telecommunications.
Simplify technical assessments with our intuitive flow chart design. Download now & save it in your presentation.
Template 1: Technical Support Flow Chart for Customer Service
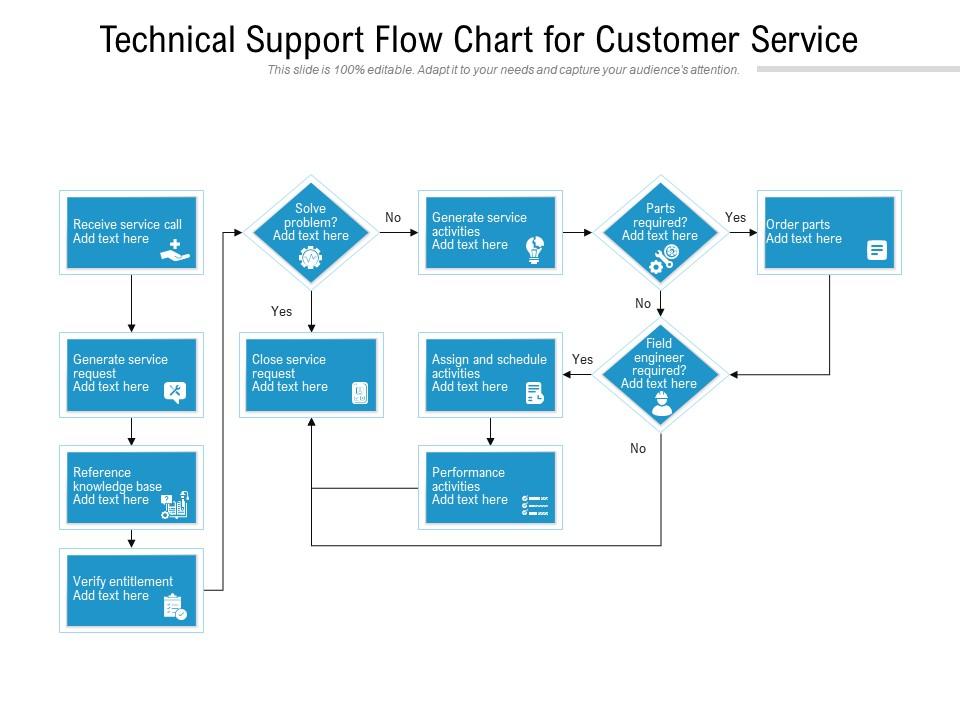
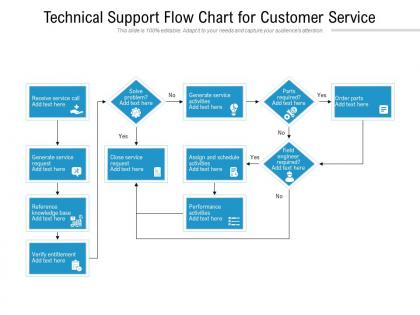
This PowerPoint slide showcases a refined technology support flowchart for customer service. It begins by receiving a service call, generating a service request, referencing the knowledge base, and verifying entitlement. The presentation template then segments the flow into branches based on whether the problem can be resolved in the first place, leading to the closure of the service request. If not, it outlines the steps for generating service activities, including determining parts requirements and involving field engineers if necessary. This PPT visual flowchart primarily benefits customer service representatives, technical support specialists, field engineers, and service managers in efficiently managing and resolving customer issues. Download now.
********
Efficient Technical Support: Streamlined Flowchart
Technology support flowchart ensures smooth operations within businesses. Besides this, it also serves as a valuable resource for navigating critical technical problems. Our presentation designs assist you in portraying the significance of streamlined problem-solving processes. These PPT slides enable you to convey your message with precision. Whether it is related to software development, IT services, or even telecommunications, these PowerPoint diagrams help you hold your position as an industry leader in the domain of technology support.
Download now and be ready to share your knowledge and expertise in the field of technology.
Technical support flow chart for customer service with all 2 slides:
Use our Technical Support Flow Chart For Customer Service to effectively help you save your valuable time. They are readymade to fit into any presentation structure.
FAQs for Technical support flow chart
So first thing - map out what you're already doing, then spot where stuff gets stuck. Your flow should hit these main points: logging the issue, figuring out how urgent it is, getting it to the right person, actually diagnosing the problem, fixing it, and closing with the customer saying "yeah, that worked." Escalation paths are super important too - you need somewhere to go when you're totally stumped. Oh and build in feedback collection somehow, plus update your knowledge base when you solve weird new problems. The whole idea is preventing tickets from just... disappearing into the void while keeping people in the loop.
Honestly, flowcharts are game-changers for tech support. Your agents get a clear roadmap instead of just guessing their way through problems. No more of those cringe "hold on, let me ask someone" moments that make customers want to scream. Everyone follows the same steps, so you get consistent results. Resolution times drop big time - like, you're actually fixing stuff on the first call instead of playing phone tag. I set one up at my last job and our metrics improved almost immediately. Worth the effort to map it out properly.
Don't overcomplicate it - too many branches and people just give up. Skip the jargon too, nobody wants to decode what you mean. Oh, and those escalation boxes? Super important even though they seem obvious. I learned that one the hard way. Test it out first with real situations before you launch anything. People forget to update these things when processes change, so put a reminder somewhere. Keep everything visual and straightforward. Every decision point needs a clear "what's next" so people don't get stuck staring at your flowchart wondering what the hell they're supposed to do.
Honestly, I'd just go with **Draw.io** (they renamed it to diagrams.net but whatever). It's free and has solid templates for tech support flows. **Lucidchart** is another good option - way cleaner interface than most tools. If your company's already paying for Microsoft stuff, Visio works but it's kind of a pain to use IMO. **Miro** is cool if you need multiple people editing at once, though sometimes it gets messy with too many cooks in the kitchen. Start with Draw.io since it won't cost you anything. You can always upgrade later if you need fancier features.
So you basically want to tailor those flowcharts to whatever industry you're dealing with. Healthcare needs all the HIPAA stuff built in, plus patient data handling steps. Manufacturing? They'll want equipment troubleshooting paths and safety protocols. Financial services are nuts with their security - seriously, they make you verify your identity like 5 different ways. Start by figuring out your top 5 industry problems first. What regulations do you have to follow? Then work backwards and build those decision points right into the flowchart structure. Makes way more sense than trying to force a generic template.
Look, feedback is what saves your flowchart from being total garbage. Your support team and customers will tell you exactly where things go wrong - confusing steps, missing scenarios, the works. Most flowcharts seem brilliant until real people touch them, then it's chaos. Set up monthly check-ins or do quick reviews after big incidents. You'll start seeing patterns pretty fast. Where do people get stuck? What's causing bottlenecks? Then just fix those spots. Don't wait for perfection either - start collecting feedback on your rough draft. It's way better than guessing what might work.
Hey! So first-call resolution and response times are your bread and butter metrics. Customer satisfaction scores too, obviously. Watch for tickets getting ping-ponged between departments - that's usually where your flowchart breaks down. I'd grab baseline numbers before changing anything, then check monthly. Agent productivity matters, but honestly the real win is when support costs start dropping while customers get happier. Oh, and escalation rates - if everything's getting bumped upstairs, something's not working. The whole point is solving stuff faster with less drama, right?
Get everyone to actually walk through the flowchart with real support tickets - don't just show them the pretty diagram. Role-playing feels awkward but honestly works way better than lectures. I'd make little reference cards for their desks with the main decision paths highlighted. Quick refresher sessions help too, especially when you change stuff. Oh and definitely ask them where they get confused - their feedback will show you which parts of your flowchart actually suck. People learn better when they're doing it hands-on rather than just staring at boxes and arrows.
Use decision diamonds for escalations - "Can agent handle this?" with yes/no branches. When it's no, show the path to L2 or specialist teams. Don't forget timing stuff because customers hate being stuck waiting forever. Map your handoff points clearly and what data gets passed up the chain. Honestly, I'd start with whatever escalations happen most in your place, then build around those real situations. Makes the whole thing way more useful than some generic flowchart. The main thing is showing escalation isn't failure - it's just part of how support actually works.
Honestly, flowcharts are a game-changer for tech support. They make it super obvious where your process gets jammed up or has weird redundant steps. New hires don't have to bug everyone with basic questions since they can just follow the visual map – which is honestly a lifesaver during busy periods. You'll probably discover workflow gaps you never noticed before. The visual thing really helps when you're explaining processes to managers or other departments who zone out reading documentation. I'd start by just mapping what you're doing now, even if it's messy, then clean it up later.
A support flowchart is basically like getting x-ray vision for your whole process. You can actually see where tickets get stuck or pile up. Time each step first - that's the part most people skip but it's super helpful. Then map everything out and look for those annoying bottlenecks where approvals take forever. The problem spots become really obvious once you visualize it all. Short sentences work better than long ones here, honestly. Use that timing data to fix the slowest parts and you'll see a huge difference.
So start with severity levels - system crashes obviously need faster response than password resets. Your team's capacity matters too since promising 2-hour responses when you're swamped just pisses everyone off. Enterprise clients will expect quicker turnaround than basic users based on what they're paying. Some issues need immediate "we got it" responses but take way longer to actually fix. Oh, and build in buffer time because stuff always takes longer than you think. Be super clear about whether you mean response time or resolution time - people mix those up constantly.
Just sprinkle feedback collection throughout your support flow - satisfaction surveys after resolving tickets, quick feedback forms when escalating issues, maybe follow-ups later. Map out where customers actually want to give input (usually after big interactions or when stuff breaks). Honestly, I've watched teams go overboard trying to collect feedback at every single step. Don't do that - it's annoying. Two or three smart spots work way better. Build these into your actual process so they happen automatically. Oh, and start with your biggest problem areas first - that's where you'll get the most useful stuff anyway.
Track your resolution times and first-contact resolution rates - those are your bread and butter metrics. Customer satisfaction scores matter too, obviously. I'd also watch escalation rates like a hawk since they tell you where things go sideways. Agent utilization is huge because nobody wants their team stressed to death, right? Monthly tracking works well for comparing against your SLAs. Set up some kind of dashboard that updates itself so you're not manually pulling reports every time. Makes it way easier to spot which parts of your flowchart are actually causing problems.
So digital transformation basically flips your whole support setup on its head. You can throw in chatbots for the initial stuff, auto-sort tickets, and set up escalation triggers based on how pissed off customers sound - which is honestly pretty cool. Instead of that boring call-and-wait routine, people jump between knowledge bases, videos, forums, whatever works. The data you get afterward is so much better too. My advice? Map out what you're doing now first, then pick a few spots where tech would actually help. Don't try to change everything overnight or you'll lose your mind.
No Reviews