


Three coordinate axis for position indication flat powerpoint design





Try Before you Buy Download Free Sample Product
 Impress Your
Audience
 100%
Editable
 Save Hours
of Time


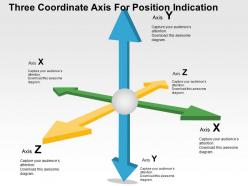
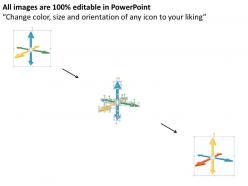
Display the creative and impressive presentation design to your audience to engage them in your presentation. Our three coordinate axis for position indication flat PowerPoint design beautifully crafted with arrows axis points. You can use this PPT template to communicate about the business and marketing ideas where arrows is the points that describes their attributes, features, stages, benefits, prospects or functions. This is our popular and adaptable presentation diagram that can be put to varied use depending upon creative thought process and the industry you are working in. The designing of the PowerPoint slide consists of arrows pointing towards the different directions along with space for writing content related to each point. The colors used are perfectly blended that makes it look very attractive. So download this amazing presentation and fill in your text to win all the laurels and accolades from your clients, seniors or even colleagues. This PPT presentation layout comprises the concept of result analysis and growth indication. Use this PowerPoint slide to fulfill your desired objective of creating it. Gain from each experience with our Three Coordinate Axis For Position Indication Flat Powerpoint Design. Extract the best from days gone by.
People who downloaded this PowerPoint presentation also viewed the following :
Content of this Powerpoint Presentation
Description:
The image is a PowerPoint slide featuring a three-dimensional coordinate system, titled "Three Coordinate Axis For Position Indication". It visualizes the three axes typically used in a 3D space:
Axis X: Represented by a green arrow pointing to the right.
Axis Y: Illustrated by a blue arrow pointing upward.
Axis Z: Shown as a yellow arrow pointing forward.
Each axis is labeled with a placeholder text saying "Capture your audience’s attention. Download this awesome diagram.", which suggests that the slide is meant to be interactive and possibly linked to data or a demonstration that the presenter can customize.
Use Cases:
This type of slide is versatile and can be used in various industries for graphical representation of data, modeling, and design, including:
1. Engineering:
Use: Demonstrating component positioning in 3D designs.
Presenter: Design Engineer.
Audience: Project team, stakeholders.
2. Education:
Use: Teaching concepts of geometry and spatial understanding.
Presenter: Educator.
Audience: Students.
3. Architecture:
Use: Visualizing building designs in three dimensions.
Presenter: Architect.
Audience: Clients, construction teams.
4. Aerospace:
Use: Mapping flight paths and aircraft orientation.
Presenter: Flight Dynamics Engineer.
Audience: Flight crew, mission planners.
5. Game Development:
Use: Creating and explaining 3D game environments.
Presenter: Game Developer.
Audience: Design team, investors.
6. Virtual Reality:
Use: Designing immersive 3D virtual spaces.
Presenter: VR Designer.
Audience: Developers, clients.
7. Geography and Mapping:
Use: Illustrating geographical data and terrain mapping.
Presenter: Geospatial Analyst.
Audience: Environmental researchers, policy makers.
Three coordinate axis for position indication flat powerpoint design with all 4 slides:
Our Three Coordinate Axis For Position Indication Flat Powerpoint Design bring out the genius in you. Your exceptional aspects come to the fore.
FAQs for Three coordinate axis for position indication
So basically you need three axes - X, Y, and Z - that all meet at one point called the origin. X goes sideways, Y goes up and down, Z handles depth. Though honestly, different software sometimes flips these around which is annoying. Every point in 3D space gets three numbers (x,y,z) that tell you how far to move from the origin along each axis. Here's the thing - figure out which way is "up" in whatever program you're using first. Trust me on this one. It'll save you headaches later when things start looking weird.
So basically, Cartesian coordinates are like a grid - you've got your x, y, z axes and you just plot points. Super straightforward. Polar and spherical coordinates? They work with angles and distances from a center point instead. Picture giving directions: Cartesian is "go 3 blocks east, 2 north" but spherical is more like "head 50 feet northeast at a 30-degree angle upward." I usually go with Cartesian for basic 3D stuff since it's simpler to wrap your head around. But spherical coordinates are actually clutch for astronomy or robotics - anything where you're rotating around fixed points. Really depends on what kind of movement you're working with.
So the origin point (0,0,0) is basically where your three axes meet up - like your starting point for everything. You measure all distances and positions from there. Without it you'd be completely lost trying to figure out where stuff actually sits in 3D space, which would be a nightmare honestly. Here's the cool part though: you can stick your origin wherever works best for your project. Makes the math way easier if you're smart about placement. It's just your reference point - nothing fancy.
So basically, 3D coordinates are like GPS for your digital stuff. You get precise control over where everything sits - vertices, cameras, lights, all using X, Y, Z values. Honestly makes debugging way less painful when you know exactly where things should be. Plus you start thinking in transformations, which is clutch for predicting how scaling and rotation mess with your models. Oh and pro tip - practice by typing in coordinate values manually instead of just dragging objects around. Trust me, it clicks way faster that way.
So basically the Z-axis is what takes you from flat 2D into actual 3D space. You've got X and Y for left/right and up/down, but Z lets you go forward and backward - like moving stuff toward you or away from you on screen. Pretty crazy how one extra dimension changes everything, right? Without Z you're just stuck on a flat surface like paper. With it, you can put objects anywhere in actual space. Oh and here's something cool - if you ever zero out all the Z values in a 3D model, everything just flattens back to 2D. It's wild to watch.
So basically, 3D coordinates are like GPS for buildings - you use X, Y, and Z points to map out where every single thing goes. Beams, walls, pipes, electrical stuff, whatever. Super handy for catching clashes before you actually build anything (trust me, way cheaper to fix on screen than with a sledgehammer). CAD programs like AutoCAD and Revit are built around this whole system. You can calculate materials, make sure everything actually fits together. Honestly, once you start noticing the coordinate notes on plans, it's kinda satisfying seeing how it all connects spatially.
Scatter plots are probably the biggest one - plotting three variables at once to find patterns. Scientists use them all the time for stuff like molecular structures and MRI scans. Geographic data looks pretty cool in 3D too, especially when you're showing elevation with latitude/longitude. Gaming obviously lives in 3D space, though that's more entertainment than actual data analysis. Oh, and network graphs sometimes add a third dimension to avoid that messy spaghetti look when you've got tons of connections. I'd start with basic 3D scatter plots in Plotly or Three.js before getting fancy with complex visualizations.
So basically you're dealing with matrix operations that mess with your object's coordinates. Translation's pretty easy - just add or subtract values to move stuff around on x, y, or z axes. Rotation though? That's where it gets weird (I still hate rotation matrices tbh). You either multiply by rotation matrices for each axis or use quaternions if you're feeling fancy. The cool part is you can chain transformations by multiplying matrices together. Super efficient. I'd honestly just start with moving things around first, then tackle the rotation headache once you've got that down.
Pick one system and stick with it religiously - mixing them will completely screw up your rotations and math. Right-handed is what you'll see in most math/physics stuff (thumb=x, fingers=y, palm=z direction). Left-handed shows up in certain graphics APIs and game engines. The naming is honestly pretty confusing at first, but it just tells you which way z points when x and y are positioned normally. Check what your tools expect first. I've seen people waste hours debugging because they switched between systems halfway through a project.
So basically, 3D coordinates tell your VR system exactly where everything is - headset, controllers, all that stuff gets tracked with precise X, Y, Z positions. Way better than just guessing locations. You know that annoying thing where you reach for something and your hand's totally off? That's drift, and good coordinates fix it. The system can track you down to millimeters instead of ballparking it. Oh and when you're setting up - make sure nothing's blocking your tracking cameras. They need clean sight lines to do all those position calculations properly.
So the biggest pain is that 2D data has no depth info - you're missing that Z-coordinate completely. You'll have to either assume something (like Z=0 for flat stuff) or guess depth values somehow. Color mapping gets weird when you're adding that extra dimension too. Honestly, I've watched so many people bang their heads against this in GIS projects - it's brutal. First figure out what your third dimension actually means, then pick a method. Could be extrusion, some math transformation, or just manually assigning values from other data you have. Really depends on your specific situation though.
Dude, 3D coordinates are huge for robotics. Your robot basically uses xyz points to figure out where it is and navigate around stuff. It's like super-precise GPS but in three dimensions. Without this, robots would just bump into everything and get lost constantly. The coordinate data powers path planning and collision detection - honestly, coordinate transformations were one of those topics I wished I'd learned better upfront. Would've saved me so much debugging time later. Pretty much every robotics project relies on this stuff, so it's worth getting comfortable with early on.
Depends what you're trying to do really. Programming-wise, NumPy for Python or Three.js for web stuff work great. If it's design work, check out Blender - it's free and honestly way better than people give it credit for. AutoCAD and SolidWorks are solid too but pricey. MATLAB or R handle data analysis well, though Excel works for basic stuff. Unity's perfect if you want something interactive. I'd just pick whatever matches the language you already know, then figure out the rest as you go. Way easier than learning everything upfront.
So basically, 3D coordinate systems are like GPS for your digital models - they tell your software exactly where everything sits in space. You've got your x, y, and z coordinates that position every point, line, and surface. Honestly, without them you'd be totally lost trying to move stuff around or calculate distances. Whether you're doing CAD work or prepping files for 3D printing, your software needs those coordinates to figure out rotations, intersections, all that geometric stuff. Oh and definitely check which coordinate system your program uses as its reference point before you start - saves headaches later.
Dude, 3D coordinates are game-changers - literally. They give players that spatial awareness that makes everything feel real and immersive. You can move in all directions, which opens up crazy possibilities for level design and combat. Compare Minecraft to old 2D platformers and you'll see what I mean. Players can hide behind stuff, climb walls, attack from weird angles. The z-axis just adds so many layers of strategy. Oh and get your coordinate system nailed down early - I learned that the hard way on my first project. Everything breaks if your foundation's wonky.
-
Great product with highly impressive and engaging designs.
-
Professional and unique presentations.