

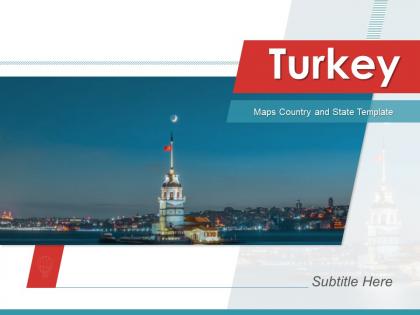
Turkey maps country and state powerpoint template


Try Before you Buy Download Free Sample Product
 Impress Your
 Audience
Editable
of Time


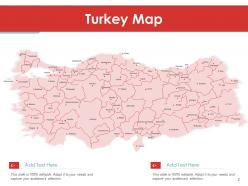
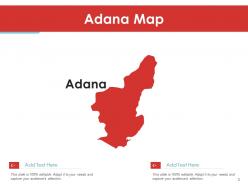
Display a wonderful presentation of data with our Turkey country and states map PowerPoint template. This Turkey plan PPT deck showcases the most fascinating cities of the country such as- Adana, Adiyaman, Afyonkarahisar, Agri, Amasya, Istanbul, and much more. Showcasing the visual plan of Adana city, this Turkey state PowerPoint layout shows different places such as Camardi, Ulukisla, Nigde, Mersin, and all the other adjoining towns. This Turkey territory chart creative PPT set presents the viewers with the overview of the province Amasya which includes districts like- Merzifon, Suluova, Merkez, Goynucek etc. Attracting the agricultural people with its presentation, this Turkey realm PowerPoint bundle gives detailed information on cultivationally famous city, Afyonkarahisar’s landmarks which reflects the sub-categorising regions such as- Erkmen, Gokce, Bryazit, Cakirkoy and so on. The perceptible showcasing of some of the renowned cities of Turkey is very engrossing to the audience which leaves a long lasting impression on everybody around. Get it now to attain that quality in your enterprise.
People who downloaded this PowerPoint presentation also viewed the following :
Content of this Powerpoint Presentation
Slide 1: This slide introduces Turkey Maps Country and State Template. State Your Company Name and begin.
Slide 2: This slide displays Turkey Map with related imagery.
Slide 3: This slide shows Adana Map.
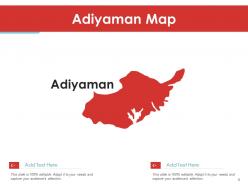
Slide 4: This slide presents Adiyaman Map.
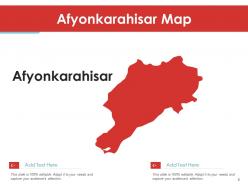
Slide 5: This slide shows Afyonkarahisar Map.
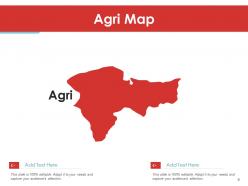
Slide 6: This slide displays Agri Map.
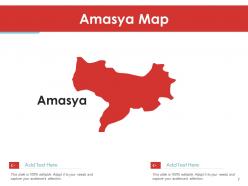
Slide 7: This slide represents Amasya Map.
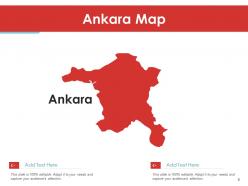
Slide 8: This slide shows Ankara Map.
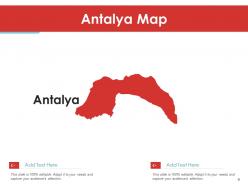
Slide 9: This slide presents Antalya Map.
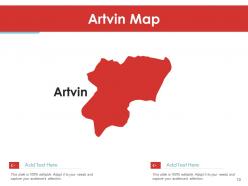
Slide 10: This slide shows Artvin Map.
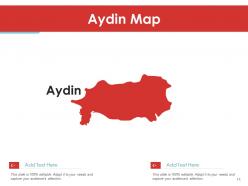
Slide 11: This slide displays Aydin Map.
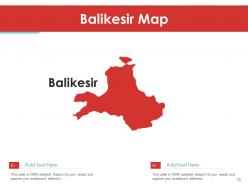
Slide 12: This slide represents Balikesir Map.
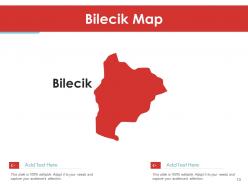
Slide 13: This slide shows Bilecik Map.
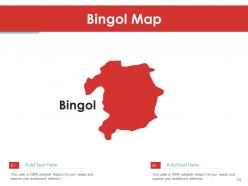
Slide 14: This slide presents Bingol Map.
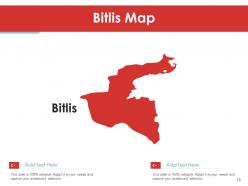
Slide 15: This slide shows Bitlis Map.
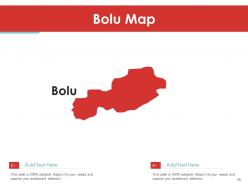
Slide 16: This slide displays Bolu Map.
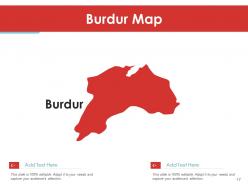
Slide 17: This slide represents Burdur Map.
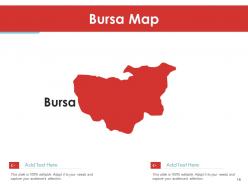
Slide 18: This slide shows Bursa Map.
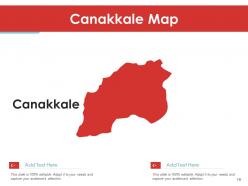
Slide 19: This slide presents Canakkale Map.
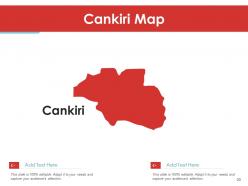
Slide 20: This slide shows Cankiri Map.
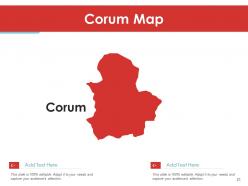
Slide 21: This slide displays Corum Map.
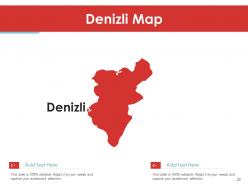
Slide 22: This slide represents Denizli Map.
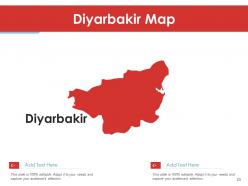
Slide 23: This slide shows Diyarbakir Map.
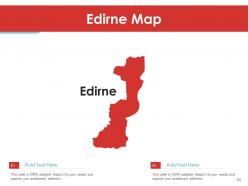
Slide 24: This slide presents Edirne Map.
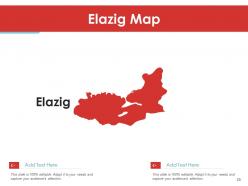
Slide 25: This slide shows Elazig Map.
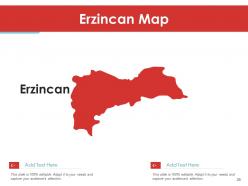
Slide 26: This slide displays Erzincan Map.
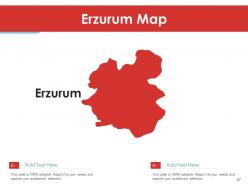
Slide 27: This slide represents Erzurum Map.
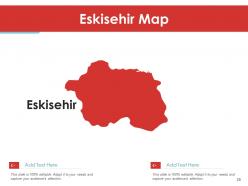
Slide 28: This slide shows Eskisehir Map.
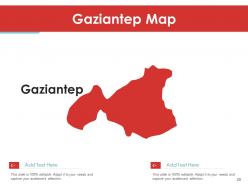
Slide 29: This slide presents Gaziantep Map.
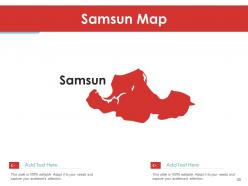
Slide 30: This slide shows Samsun Map.
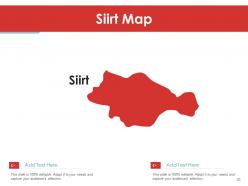
Slide 31: This slide displays Siirt Map.
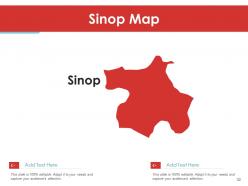
Slide 32: This slide represents Sinop Map.
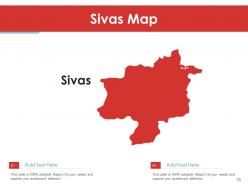
Slide 33: This slide shows Sivas Map.
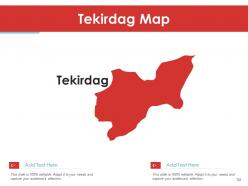
Slide 34: This slide presents Tekirdag Map.
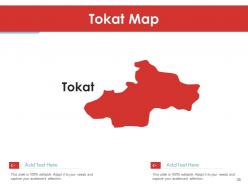
Slide 35: This slide shows Tokat Map.
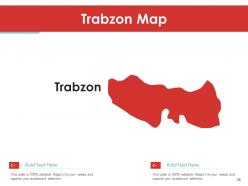
Slide 36: This slide displays Trabzon Map.
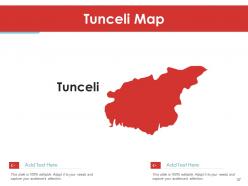
Slide 37: This slide represents Tunceli Map.
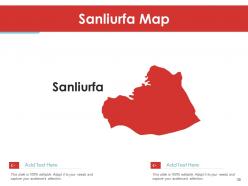
Slide 38: This slide shows Sanliurfa Map.
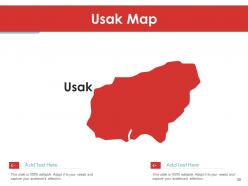
Slide 39: This slide presents Usak Map.
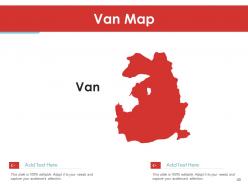
Slide 40: This slide shows Van Map.
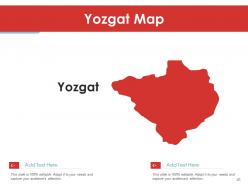
Slide 41: This slide displays Yozgat Map.
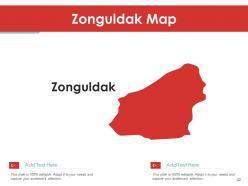
Slide 42: This slide represents Zonguldak Map.
Slide 43: This slide shows Aksaray Map.
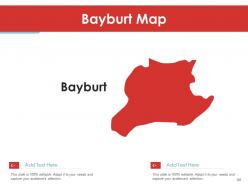
Slide 44: This slide presents Bayburt Map.
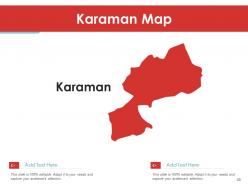
Slide 45: This slide shows Karaman Map.
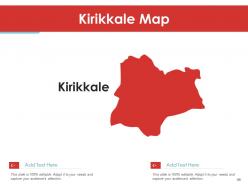
Slide 46: This slide displays Kirikkale Map.
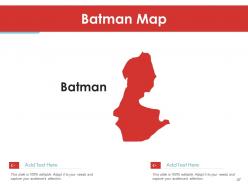
Slide 47: This slide represents Batman Map.
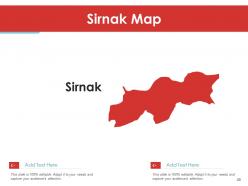
Slide 48: This slide shows Sirnak Map.
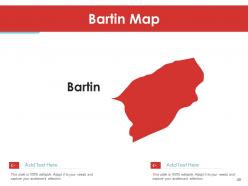
Slide 49: This slide presents Bartin Map.
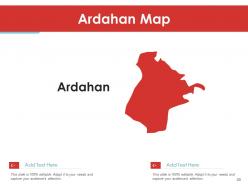
Slide 50: This slide shows Ardahan Map.
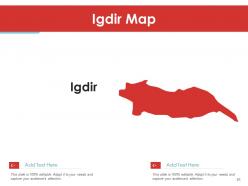
Slide 51: This slide displays Igdir Map.
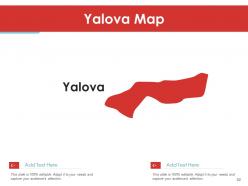
Slide 52: This slide represents Yalova Map.
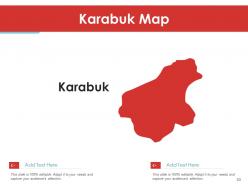
Slide 53: This slide shows Karabuk Map.
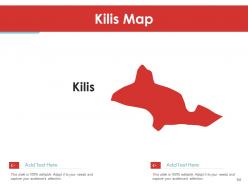
Slide 54: This slide presents Kilis Map.
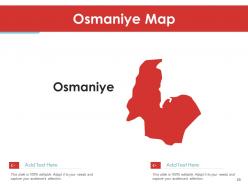
Slide 55: This slide shows Osmaniye Map.
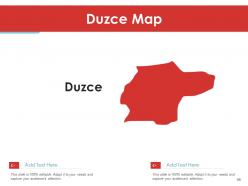
Slide 56: This slide displays Duzce Map.
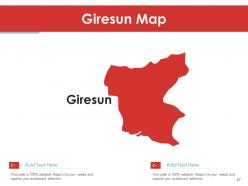
Slide 57: This slide represents Giresun Map.
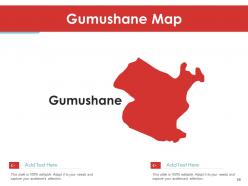
Slide 58: This slide shows Gumushane Map.
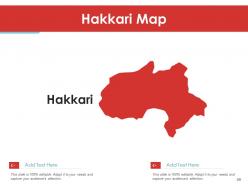
Slide 59: This slide presents Hakkari Map.
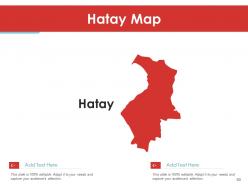
Slide 60: This slide shows Hatay Map.
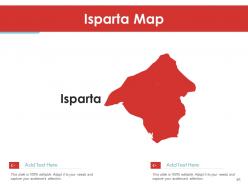
Slide 61: This slide displays Isparta Map.
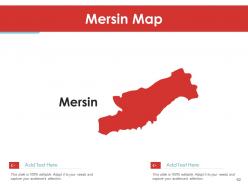
Slide 62: This slide represents Mersin Map.
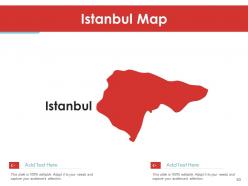
Slide 63: This slide shows Istanbul Map.
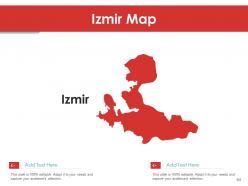
Slide 64: This slide presents Izmir Map.
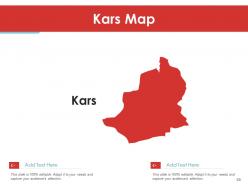
Slide 65: This slide shows Kars Map.
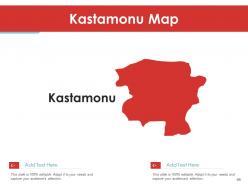
Slide 66: This slide displays Kastamonu Map.
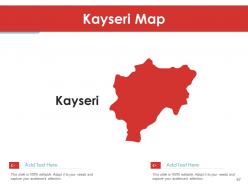
Slide 67: This slide represents Kayseri Map.
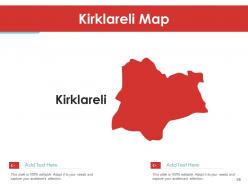
Slide 68: This slide shows Kirklareli Map.
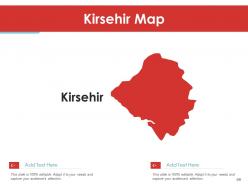
Slide 69: This slide presents Kirsehir Map.
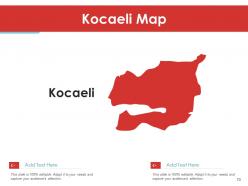
Slide 70: This slide shows Kocaeli Map.
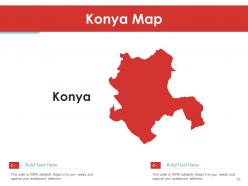
Slide 71: This slide displays Konya Map.
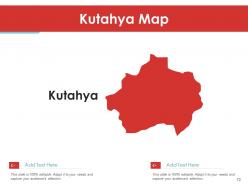
Slide 72: This slide represents Kutahya Map.
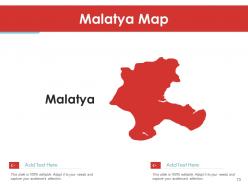
Slide 73: This slide shows Malatya Map.
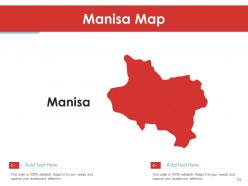
Slide 74: This slide presents Manisa Map.
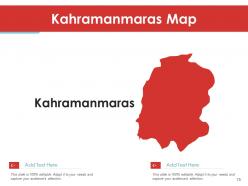
Slide 75: This slide shows Kahramanmaras Map.
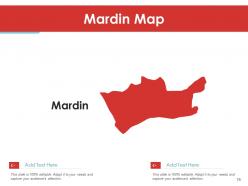
Slide 76: This slide displays Mardin Map.
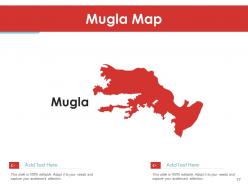
Slide 77: This slide represents Mugla Map.
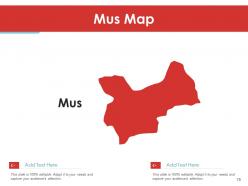
Slide 78: This slide shows Mus Map.
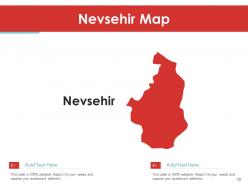
Slide 79: This slide presents Nevsehir Map.
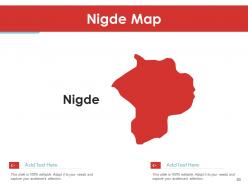
Slide 80: This slide shows Nigde Map.
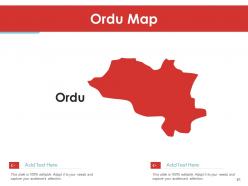
Slide 81: This slide displays Ordu Map.
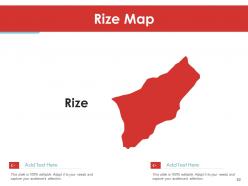
Slide 82: This slide represents Rize Map.
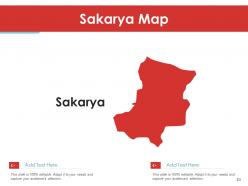
Slide 83: This slide shows Sakarya Map.
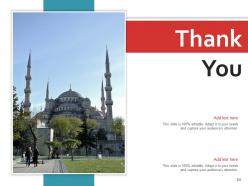
Slide 84: This is a Thank You slide with address, contact numbers and email address.
Turkey maps country and state powerpoint template with all 84 slides:
Use our Turkey Maps Country And State Powerpoint Template to effectively help you save your valuable time. They are readymade to fit into any presentation structure.


FAQs for Turkey maps country and
Get one with editable vector graphics so you can change colors and highlight whatever regions you need. Different map styles are clutch - outline maps, political boundaries, city markers. I learned the hard way to check PowerPoint compatibility first lol. Moving text boxes around should be super easy for your own labels and data. Some templates have both full country views and zoomed regional stuff which is pretty handy. Oh, and definitely download a sample to test quality before you buy anything. Trust me on that one.
Maps just work better than dumping a bunch of numbers on people. Your audience can actually see where stuff's happening instead of trying to picture it in their heads. Color-coding different regions makes patterns super obvious - way better than buried spreadsheet data that nobody wants to dig through. Honestly, anything beats another boring slide full of bullet points. Put your main insights right on the map itself. People connect with visual stuff faster, and it looks way more professional too.
Turkey maps are perfect for showing population data, sales territories, or economic stuff by region. Tourism stats work really well too. Honestly, any location-based data looks way better on a map than in some boring spreadsheet - your audience will actually pay attention. Just make sure whatever you're mapping actually connects to Turkish cities or provinces, otherwise it's pointless. Oh, and market penetration data is solid for this too. Pick colors or symbols that make your patterns obvious. The whole point is telling a geographic story that people can see at a glance.
So for Turkey maps, I'd totally go with colors that match their flag - deep reds, whites, maybe some gold. Blues work great too since Turkey's got all that coastline. Don't do anything too bright or neon though, trust me on that one lol. Earthy stuff like burgundy or navy creates nice contrast when you're highlighting different areas. Just make sure your text is dark enough to actually read! Oh and stick to like 3-4 colors max - otherwise it gets messy fast.
Turkey maps in PowerPoint are great for showing sales data by region - way better than staring at spreadsheets all day. You can color-code different provinces to show revenue, customer clusters, or where competitors are strongest. Really helps when you're trying to spot which areas aren't performing well or figuring out expansion opportunities. Your team will actually pay attention during presentations instead of zoning out. Just double-check you're using the right Turkish provinces though - I've seen people mess that up and it gets awkward when someone from Istanbul calls you out on it.
So many cool options for your Turkey map! Ottoman crescents and stars are classic, or you could go with Byzantine architectural stuff. The Bosphorus is perfect since it's literally where Europe meets Asia - such a cool geographic feature. Ancient sites work great too: Troy, Cappadocia's weird rock formations, Hagia Sophia. Oh, and Turkish carpets or tulip patterns (fun fact - tulips are actually from Turkey originally, not Holland!). Turkish calligraphy looks amazing if you're into that aesthetic. Just don't go overboard though. Pick maybe 2-3 elements that actually fit your theme instead of throwing everything at it.
Turkey's tricky because the west (Istanbul, Ankara) will totally overwhelm your charts if you use raw numbers. Eastern regions just disappear. I've dealt with this so many times with demographic stuff - it's annoying! Per-capita metrics work way better for showing actual regional differences. The Europe/Asia split is pretty cool for storytelling though. Try color coding by geographic zones or use different intensities to highlight variations. Population-adjusted scales will save you from having everything look lopsided toward the major cities.
First thing - test it with whatever PowerPoint version you're using. Modern templates usually work fine with 2016+, but older versions can be weird about it. Does your team use Google Slides or Keynote too? Some templates get messy when you convert them (trust me on this one). Vector-based Turkey maps tend to play nicer across different platforms than the image-heavy ones. Any animations or interactive stuff might not work for everyone presenting. Honestly, I'd download just one sample slide first and test it on everyone's setup before buying the whole template. Saves headaches later.
Honestly, go with vector - they scale without getting all pixelated and gross. Raster images turn into a blurry mess the second you resize them. Vector maps stay crisp even if you blow them up huge for a presentation. Plus you can edit individual parts super easily, like changing colors or tweaking borders. Each element is basically its own thing. Raster? Good luck editing anything unless you're some Photoshop master. Oh and vector files are way smaller too, so they won't kill your computer when you're trying to present.
So basically you can make your Turkey maps way more interactive with PowerPoint's hyperlinks and action buttons. Link different regions to jump to detail slides, or set up triggers so text boxes pop up when people click cities. Hover effects are actually pretty cool looking if you do them right. Oh, and you can drop clickable icons or hotspots over map areas too. Just don't go crazy with it - I've seen people add like 20 interactive things and it's just confusing. Start simple with maybe 3-4 major regions linking to separate slides, then add more stuff later.
Okay so first thing - don't cram too much data on there or nobody will be able to read it. Your color scheme needs to actually reflect what's happening regionally, and I swear I've sat through way too many meetings where someone had the colors completely backwards lol. Label those provinces clearly because honestly most people can't identify them on sight. Keep your legend straightforward and don't stick it somewhere that covers up key areas. Oh, and this should be obvious but double-check your data matches the right regions before you present! Lead with your main point first, then use the map to back it up.
Turkey maps in PowerPoint are perfect for geography lessons - you can highlight different regions when covering the Ottoman Empire or modern cultural stuff. Honestly, Turkey's geography is just stunning to work with visually. Students really get spatial relationships better when they can see you click through different areas on an interactive map. Use different colors for population density, climate zones, or historical boundaries. Makes everything way more engaging. Also works great for economic patterns across provinces and cities. Your students won't zone out like they usually do with regular textbook maps - trust me on this one.
Honestly, go super minimal with Turkey maps in presentations. Clean borders, maybe 2-3 colors tops, and just show the key cities that actually matter to your topic. I've watched too many people cram every single province and geographic detail onto one slide - total mess. Nobody in the back row can read that stuff anyway. Skip the cartographic perfection thing. You want instant recognition, not a geography textbook page. Only highlight regions that tie directly to whatever you're talking about. Less is definitely more here, and your point will come across way clearer.
Start with simple fade-ins to reveal different regions as you talk about them. Way better than dumping everything on screen at once! Animate your data points so they pop up one by one - keeps people actually paying attention. Motion paths work great for showing trade routes or travel flows across the country. The timing thing is huge though - you want the visuals syncing up with what you're saying. I'd honestly master the basic stuff first before getting fancy with complex sequences. Oh and pro tip - test it beforehand because Turkey's a big country and you don't want animations dragging on forever.
Honestly, SlideModel's your best bet if you can spend a little - their Turkey map templates are actually designed for presentations so you won't be wrestling with formatting forever. PresentationGo's decent too. Free options? SlidesCarnival has some okay stuff, or just browse Google Slides templates, though half of them look pretty rough tbh. Oh, and if you need crazy detail, grab a vector map from Freepik or Vecteezy and drop it into PowerPoint. Way more control that way. I'd probably start with SlideModel though - saves so much headache.
-
Great quality slides in rapid time.
-
Great product with effective design. Helped a lot in our corporate presentations. Easy to edit and stunning visuals.
-
Graphics are very appealing to eyes.