


Cartes PowerPoint des pays des États-Unis





Try Before you Buy Download Free Sample Product
 Impress Your
Audience
 100%
Editable
 Save Hours
of Time


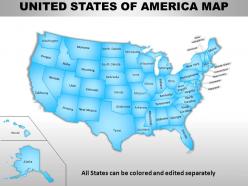
Incorporez notre modèle de cartes PowerPoint des pays des États-Unis qui vous aidera à mettre en évidence les perspectives commerciales et la croissance aux États-Unis en l'affichant de manière visuellement attrayante. Ce modèle PowerPoint contient toutes les diapositives utiles pour votre entreprise et votre usage personnel. Vous pouvez représenter vos fonctions commerciales dans n'importe quel état sur la carte en changeant simplement la couleur de la région, en ajoutant une épingle ou une icône, etc., car cette carte des États-Unis est entièrement modifiable. Vous pouvez facilement mettre en évidence n'importe quel état unique ou un groupe d'états avec ces cartes pré-conçues de diaporama PPT USA. La carte de diapositive est utile pour montrer les emplacements où vous souhaitez créer de nouvelles unités d'entreprise et développer bientôt votre entreprise. En montrant visuellement toutes les unités, votre public sera engagé et trouvera cela intéressant car il leur sera facile de visualiser et de comprendre en utilisant notre incroyable conception PowerPoint. Alors, ne perdez pas votre temps en réfléchissant à la façon de mettre en évidence les caractéristiques importantes de votre entreprise et téléchargez cette superbe carte de diapositives PPT et utilisez-la maintenant. Nos cartes Powerpoint des États-Unis ne sont pas chauvines. Ils sont bons pour lui et pour elle.
People who downloaded this PowerPoint presentation also viewed the following :
Cartes Powerpoint des pays des États-Unis avec les 65 diapositives :
Avec un design ciblé sur la communauté internationale des présentations, ces cartes Powerpoint des États-Unis sont idéales pour les présentations. Des milliers de modèles parmi lesquels choisir.


FAQs for Usa
Choropleth maps are huge - those color-coded state ones. Basic outline maps with markers work great too. Honestly, regional maps focusing on specific areas are way better than trying to cram the whole US into one slide (gets messy fast). Heat maps are perfect for sales data or demographics across states. Pin maps show office/store locations really well. Oh and pro tip - don't go crazy with the colors. People sitting in back rows need to actually see what you're showing them, so contrast matters more than you think.
Honestly, thematic maps are game-changers for this stuff. Instead of staring at boring spreadsheets, you can actually *see* the patterns geographically. Heat maps showing poverty rates? Mind-blowing how clearly they reveal concentrated pockets you'd totally miss otherwise. Choropleth maps work really well for state comparisons - median income, education levels, whatever. You'll spot urban vs rural disparities instantly, plus see how different factors cluster together in specific regions. I always map my data first now before diving into analysis. It's like having x-ray vision for demographic trends, seriously.
Honestly, ditch the basic PowerPoint shapes and go digital. Tools like Tableau or ArcGIS Online let you customize colors, add data overlays, and create interactive hotspots that actually keep people awake. Google My Maps works too if you're not super tech-savvy. The cool thing is you can highlight specific regions, update data in real-time, and export high-res versions. Interactive elements are where it's at - clickable maps beat static ones every time. I'd probably spend like 5 minutes figuring out what you want to show first, then pick whichever tool doesn't make you want to pull your hair out.
So these maps use colors or dots to show how many people live per square mile - super helpful for seeing where everyone's actually clustered. NYC, LA, Chicago all light up like crazy while huge chunks of rural America look basically empty. It's wild how unevenly spread out we are, honestly. The cool part is watching how cities sprawl outward into suburbs, creating these massive metro blobs. If you can find maps from different years, you can literally see cities expanding over time - kind of fascinating to compare decades.
Political maps are all about the stuff humans created - state borders, cities, capitals, counties. Physical maps show the natural landscape instead - mountains, rivers, deserts, elevation changes. Like if you're looking at a US political map, you'll see all 50 states with their boundaries marked out, plus major cities and probably highways too. Physical ones focus more on things like the Rockies or Mississippi River. Basically all the geography that existed before we started slicing everything up into neat little sections. Just pick whichever one has the info you actually need.
Dude, interactive maps are seriously addictive - people can't stop clicking around once they start exploring. Way better than making your audience stare at boring spreadsheets, right? Your viewers can drill down into specific states, compare different regions, or toggle between data sets in real time. Color coding works great for showing trends across states. Honestly, I always get a little carried away with the animations myself. Just make sure your data actually tells a clear geographic story and give people a few seconds to mess around before jumping to your next point.
Start with the Treaty of Paris map from 1783 - shows our borders right after we got independence. The Louisiana Purchase (1803) is crazy important since it literally doubled our size overnight. Wild stuff. Then check out maps from the Mexican-American War and Gadsden Purchase to see how we snagged the Southwest. Alaska Purchase from 1867 finishes the story. Library of Congress has amazing digital maps you can actually zoom into - way better than the blurry textbook versions I remember from school.
Pick colors that match your data type. Categorical stuff like regions? Go with distinct colors - blues, oranges, greens. Sequential data needs gradients in the same color family. Never use red and green together (colorblind people can't distinguish them). This one's huge - think about where you'll present it. Your gorgeous color map turns into gray mush when printed. I always squint-test my maps or ask someone else to look. If they spot the patterns right away, you're golden. Short sentences work. Longer ones with natural flow keep things interesting.
Honestly, just go straight to the Census Bureau's TIGER/Line files - they're free and way better than the random stuff you'll find elsewhere. I used to mess around with sketchy shapefiles until someone told me about these. They update them every year and the data's solid. USGS has good stuff too if you need terrain features or whatever. For quick projects though? Natural Earth is clutch - their simplified versions are clean and you don't have to deal with crazy detailed survey data. But yeah, start with TIGER files. They'll cover most of what you need.
Honestly, get a good USA map and just start marking stuff up with different colored pins - starting point, stops, where you're ending up. Way better than staring at boring turn-by-turn directions all day. I always do this for road trips and it's a game changer. Mark the scenic routes too, plus any cool attractions you don't want to miss. Oh and definitely use one of those interactive online maps if you can - they'll show you traffic patterns, gas stations, hotels, all that good stuff layered right on top of your route.
Scale distortion is such a pain - rural vs urban areas never look right on the same map. Plus Alaska and Hawaii mess up all your proportions. Choosing boundaries is another headache since counties, census tracts, and states each tell totally different demographic stories. Color schemes get tricky too because you've got to think about colorblind users but still make patterns pop. Oh, and don't even get me started on how census data can be weirdly outdated sometimes. Honestly though, figure out your audience first, then what story you're trying to tell. The visualization method will follow from there.
Maps just make data click instantly, you know? Your brain processes visual patterns way faster than spreadsheets. Color-code different regions, use icons or sizing to show comparisons - suddenly migration patterns or election results tell a clear story. People actually want to look at maps too, which honestly beats boring charts any day. Start with what you're trying to prove first, then pick map elements that back it up. Don't dump every data point on there though - gets messy fast. Think state-by-state breakdowns or tracking changes over time. Way more engaging than tables.
So for US maps, biggest fonts go on states, then major cities, then smaller stuff like towns. Put city labels up and to the right of the dot if you can. Rivers and mountains look way better when you curve the text along them - trust me on this one. Stick with black for borders, blue for water, brown for elevation. The thing that'll really mess up your map though? Too many labels crammed everywhere. Pick what actually matters for whatever you're trying to show. Oh and definitely check how it looks at the actual size people will see it.
Dude, 3D maps are a game changer. Instead of squinting at those weird contour lines, you actually *see* how massive the Rockies are or how the Appalachians cut through the East. First time I looked at one I was like wow, no wonder certain cities ended up where they did. Rivers make way more sense too - you can see exactly how they carved through mountains and valleys. Honestly just start with your own state, you'll spot stuff you never noticed on regular maps. The whole landscape just clicks differently when you've got that depth.
Dude, AR is gonna completely change how we do map presentations. Picture this - your audience can walk around 3D US maps while you overlay real-time data, demographics, whatever you need right onto the regions. No more boring slide decks. People just point at states to dive deeper or stack multiple data layers at once. I saw a demo last month and honestly? It's wild. The tech isn't everywhere yet but it's moving fast. You should mess around with some basic AR apps now - trust me, your company's gonna want this soon and you'll look like a genius for being ready.
-
Much better than the original! Thanks for the quick turnaround.
-
Unique research projects to present in meeting.