

Use of funds powerpoint slide templates download





Try Before you Buy Download Free Sample Product
 Impress Your
Audience
 100%
Editable
 Save Hours
of Time


Effectively argue your case with our Use Of Funds Powerpoint Slide Templates Download. Folks are bound to give consent.
People who downloaded this PowerPoint presentation also viewed the following :
Use of funds powerpoint slide templates download with all 5 slides:
Create a buzz about forthcoming events with our Use Of Funds Powerpoint Slide Templates Download. It will generate interest.
FAQs for Use of funds powerpoint
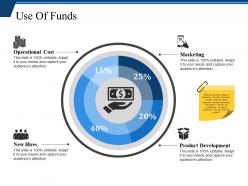
Yeah, so definitely break down your percentages clearly - like specific dollar amounts for each bucket. Pie charts or bar graphs help a ton. Keep your categories simple though, no fancy business jargon that'll make people's eyes glaze over. Oh, and timelines are huge. Investors get antsy when they don't know when you're actually spending their cash. Make categories broad enough to matter but detailed enough that you look like you've done your homework. One thing - always add a "contingency" line item, maybe 5-10%. Shows you're not completely delusional about how perfectly plans go.
Your "Use of Funds" slide needs to tell a story, not just dump numbers on people. Skip the boring bullet points with percentages - honestly, those are instant sleep triggers. Instead, show investors the actual journey their money takes. Flow charts work great, or even simple icons that connect spending to real outcomes. Like, don't just say "30% marketing." Show how that marketing spend gets you to your next growth milestone. Use colors to highlight what matters most. The whole thing should feel strategic, not like you're just accounting for every dollar. Make them see the bigger picture, you know?
For budget breakdowns, pie charts are clutch - super easy to see percentages at a glance. Stacked bars work well if you're comparing different time periods or departments. Waterfall charts are actually pretty cool for showing fund flow but most people haven't seen them before. Don't go crazy with colors though, like 5-7 categories max or it'll look messy. Treemaps can be useful but they confuse people sometimes. I'd start simple with a pie chart first. You can always get fancier later if you need to show more detail or tell a bigger story.
Honestly, templates are a lifesaver for financial presentations. You'll get consistent fonts and colors across everything, which stops your slides from looking thrown together at the last minute. Time-wise, they're huge – no more building decks from zero every single time. Your whole team can use them too, so everything matches and looks actually professional when you're presenting to higher-ups. I learned this the hard way after submitting some pretty rough-looking charts early in my career. Just drop your numbers into the template and you're basically done. Way better than stressing over formatting when you should be double-checking your calculations instead.
Ugh, the worst thing people do is cram way too much detail on one slide. Like, nobody needs to see every tiny expense broken down! Stick to broad categories - "Product Development: 40%" instead of listing out staplers and coffee. Pie charts are honestly terrible for this stuff too, they just make everyone squint. Always explain WHY you're spending money that way though - I've seen so many pitches where they just throw numbers at you with zero context. Oh, and skip the fancy animations. People need to focus on your actual financials, not spinning graphics. Double-check your math adds up to 100% too!
Yeah, colors totally mess with how people read your budget stuff. Blues and greens make everything look trustworthy and stable - great for showing you're not blowing money. Red's tricky though. People see it and think "oh shit, something's wrong" even when it's not. Orange actually makes numbers feel friendlier somehow? Gray looks professional but honestly kinda puts people to sleep. My advice: stick to 2-3 colors tops or it gets messy. Also, definitely run it by someone else first - I learned that the hard way when my boss thought our Q3 gains looked like warnings because I used too much red.
Honestly, just go with a pie chart for budget stuff. People get it right away - they can see where the big chunks of money are going without thinking too hard. Bar charts work well too, especially if you've got a ton of categories to show. You can stack bars to compare different time periods, but don't go crazy with too many segments or it'll look like a mess. Oh, and skip those donut charts - I know they look cool but they're actually harder to read than regular pies. Trust me on this one.
Templates are a total game-changer, honestly. You just dump your data into pre-made slides instead of building everything from scratch. No more wrestling with PowerPoint for hours trying to get charts and tables to look decent. I used to hate that part! The visual stuff is already handled, so you can actually focus on the numbers and your story. Just swap out colors or fonts to match your company's look. Oh, and don't make them too obvious - nobody wants cookie-cutter presentations that scream "template."
Honestly, callouts and annotations are lifesavers for financial presentations. People get lost in spreadsheet hell otherwise. Use them to point out the big trends or explain why numbers suddenly jumped - like when you have that weird Q3 spike nobody saw coming. Don't go crazy though. I've watched executives zone out when every single data point has a little bubble attached. Pick your top three takeaways first, then build annotations around those stories. Short and sweet works better than paragraphs of explanation. Focus on what'll actually help them make decisions.
Okay so basically you gotta match your presentation to who's listening. Investors want the big picture stuff - ROI numbers, strategic impact, that high-level view. They don't care about operational details. Your internal team though? They need all the specifics - line items, which departments are spending what, how you're actually gonna execute this thing. Honestly, I just keep two different templates because switching back and forth is such a pain. For internal presentations, ditch the fancy finance speak and use normal language. Investor decks are the opposite - they expect that formal terminology. Oh, and definitely run your slide by someone from your target audience first. Saves you from totally bombing the presentation.
A summary slide is honestly a lifesaver after you've droned on about budget details. People's eyes glaze over during those number-heavy sections, so this snaps them back to attention. Show them the big picture - where the money's actually going and why it matters. I always use this space to connect everything back to your main goals and highlight the smartest investments. Your stakeholders need those clean talking points they can repeat later (trust me, they'll butcher it otherwise). Don't skip this part. Make it clear enough that someone could walk out and explain your funding strategy to their boss without stumbling.
Honestly, less is more with pitch deck animations. Go for subtle stuff - maybe gentle fade-ins when you're showing funding categories, or simple slides between budget sections. You don't want investors rolling their eyes at bouncing text (seen it happen). Stick with one animation style throughout so it looks polished. Progressive reveals work great for funding breakdowns - lets you walk through each piece without dumping everything on screen at once. Skip the spinning graphics entirely, they're just distracting. Your main goal is guiding their attention to the numbers that matter. Oh, and definitely test the timing beforehand so nothing drags during your actual presentation.
Definitely put your data sources right on each slide - tiny font at the bottom works fine. Source name, report title, date. Trust me, you'll thank yourself later when someone inevitably asks "where'd you get this number?" and you're not scrambling to remember. Internal stuff needs labels too, like "Q3 Finance reports" or whatever system you pulled from. Multiple sources on one slide? List 'em all. I know it seems like extra work, but your audience won't buy into sketchy numbers. Clear sourcing makes you look way more credible than those presentations where people just throw around random stats.
Honestly, visual comparisons are your best friend here. Before/after charts work great - show what you invested versus what came back. Bar graphs comparing costs to revenue are solid too. Waterfall charts are kind of my obsession because they walk people through the money flow step by step, which is super helpful when you're presenting to executives who zone out easily. Make your percentages and dollar amounts pop with big, bold text. Nobody wants to squint at tiny spreadsheet numbers. If you don't have real data yet, just use numbers from similar projects as examples.
Honestly, get your data story figured out first before you even touch the template. Excel or Google Sheets are obvious for building your models and charts. Canva's pretty solid for custom icons when templates feel too cookie-cutter (which happens all the time, let's be real). For charts that actually look decent, try Tableau or those simple online generators - way better than PowerPoint's basic stuff. Stock photos are clutch too. Oh, and definitely have your brand guidelines handy if you're doing this for work. The whole thing flows so much better when you know what story you're telling.
-
Unique and attractive product design.
-
Innovative and Colorful designs.