


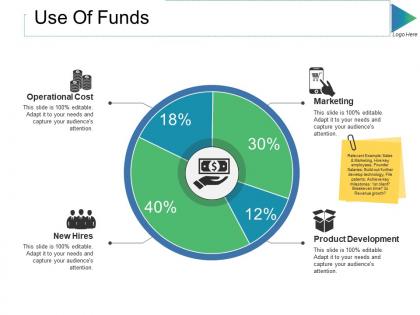
Use of funds ppt slides clipart




Try Before you Buy Download Free Sample Product
 Impress Your
 Audience
 100%
100% Editable
 Save Hours
 of Time


Cut down the journalese with our Use Of Funds Ppt Slides Clipart. Ensure the issue becomes easy to figure out.
People who downloaded this PowerPoint presentation also viewed the following :
Use of funds ppt slides clipart with all 5 slides:
Get your thoughts to their comfort zone. Let our Use Of Funds Ppt Slides Clipart mould the surroundings.

FAQs for Use of funds
Primary categories in a use of funds statement include capital expenditures, operational expenses, debt repayment, working capital requirements, and strategic investments like acquisitions or R&D. These categories enable organizations to demonstrate financial accountability, strategic resource allocation, and growth planning, with many investors and stakeholders finding that detailed expense breakdowns enhance transparency and support informed decision-making across various business scenarios.
Startups can effectively allocate fundraising by prioritizing product development, talent acquisition, marketing initiatives, operational infrastructure, and strategic reserves based on growth stage and market conditions. Through careful resource planning, many startups find that allocating 40-50% toward core development, 25-30% for team expansion, and 15-20% for customer acquisition delivers sustainable growth while maintaining financial flexibility for unexpected opportunities.
Transparency strategies include regular financial reporting, stakeholder dashboards, third-party audits, public disclosures, and real-time budget tracking systems. These approaches streamline accountability by providing clear fund allocation visibility, automated compliance monitoring, and accessible performance metrics, with many organizations finding that enhanced transparency ultimately delivers stronger stakeholder trust and improved operational credibility.
Different industries tailor their use of funds presentations to reflect sector-specific priorities, regulatory requirements, and stakeholder expectations. Technology companies emphasize R&D and innovation investments, while manufacturing firms focus on equipment and infrastructure spending, and healthcare organizations highlight compliance and patient care investments. These industry-focused approaches enable more targeted investor communication, enhanced credibility with sector-specific audiences, and clearer demonstration of strategic alignment, ultimately delivering stronger stakeholder confidence and more effective capital allocation messaging.
Key metrics should include projected ROI, timeline milestones, cost-per-acquisition ratios, revenue growth forecasts, and operational efficiency targets. These financial indicators enhance credibility by demonstrating measurable outcomes and strategic planning, with investors and stakeholders increasingly expecting data-driven projections that showcase competitive advantage and sustainable growth potential.
Visual presentation templates enhance use of funds clarity through standardized formatting, intuitive data visualization, consistent categorization schemes, and strategic color coding that highlights key allocations. These design elements streamline complex financial information by creating logical information hierarchies, enabling stakeholder comprehension across departments, and ultimately delivering transparent reporting that builds investor confidence while minimizing misinterpretation risks.
Nonprofit organizations can tailor their use of funds presentations by emphasizing transparency through detailed breakdowns, showcasing measurable impact with specific beneficiary numbers, and aligning expenditures with donor values and interests. Through compelling storytelling, visual infographics, and regular updates, organizations demonstrate accountability and program effectiveness, ultimately building donor trust and encouraging continued support in an increasingly competitive philanthropic landscape.
Common mistakes include being overly vague about fund allocation, underestimating operational costs, neglecting contingency planning, and failing to align expenditures with strategic objectives. These oversights can undermine investor confidence by creating unrealistic financial projections, with many startups finding that detailed, category-specific breakdowns with 10-15% contingency buffers ultimately deliver greater credibility and operational flexibility.
Historical fund usage data enhances financial planning presentations by revealing spending patterns, identifying cost inefficiencies, and highlighting successful investment areas that generated strong returns. This analysis enables organizations to make data-driven budget allocations, set realistic financial targets, and demonstrate accountability to stakeholders, ultimately delivering more accurate forecasts and strategic resource optimization for competitive advantage.
Financial forecasts provide critical validation for use of funds requests by demonstrating projected revenue growth, cash flow requirements, market demand analysis, and return on investment timelines. These data-driven projections enable investors and stakeholders to assess risk levels, evaluate growth potential, and understand resource allocation strategies, with many funding organizations finding that detailed forecasts significantly strengthen credibility and approval likelihood.
Visual aids effectively communicate complex use of funds data by transforming numerical information into digestible charts, graphs, and infographics that highlight spending patterns, budget allocations, and financial priorities. These visual tools enable stakeholders to quickly grasp resource distribution across departments, projects, and timeframes, while interactive dashboards and comparison charts help organizations demonstrate fiscal responsibility and strategic alignment, ultimately enhancing transparency and stakeholder confidence.
Investors should ask about fund allocation priorities, expected ROI timelines, contingency planning for setbacks, management's track record with previous funding rounds, and specific milestones tied to each expenditure category. These inquiries reveal strategic thinking, operational efficiency, and risk management capabilities, with many successful investors finding that companies demonstrating clear accountability and measurable outcomes ultimately deliver stronger returns and sustainable growth.
Companies demonstrate expected impact by developing detailed financial projections, setting measurable KPIs, creating timeline-based milestones, and establishing transparent reporting frameworks that track both quantitative and qualitative outcomes. Through impact measurement tools and regular stakeholder updates, organizations can showcase projected revenue growth, market expansion, or social benefits like job creation and community development, ultimately building investor confidence and accountability.
Crowdfunding use of funds sections should prioritize product development costs, marketing and advertising expenses, manufacturing or production investments, operational overhead, and fulfillment logistics. These elements demonstrate transparency and accountability to potential backers, with successful campaigns in technology, consumer goods, and creative industries finding that detailed breakdowns build trust, reduce funding risks, and ultimately deliver higher contribution rates and stronger backer confidence.
Debt financing restricts fund usage to specific purposes outlined in loan agreements, with lenders monitoring expenditures closely, while equity financing offers greater flexibility for strategic initiatives, expansion, and operational investments. Many companies find that debt works well for asset purchases and working capital, whereas equity enables broader growth strategies, research and development, ultimately delivering enhanced operational flexibility and competitive positioning.
-
Great product with effective design. Helped a lot in our corporate presentations. Easy to edit and stunning visuals.
-
It saves your time and decrease your efforts in half.