


Water quality assessment powerpoint presentation slides





Try Before you Buy Download Free Sample Product
 Impress Your
 Audience
 100%
100% Editable
 Save Hours
 of Time


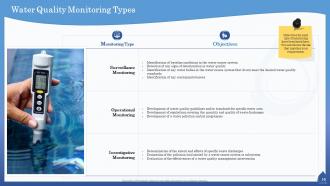
Introducing Water Quality Assessment Powerpoint Presentation Slides. Our readily available water monitoring system PowerPoint slide designs provide an overview of market size, growth rate, and capital expenditure. Demonstrate the division of the wastewater treatment market by editing our content-ready water quality check PPT slide deck. You can easily present the key statistics that play a vital role in analyzing the water industry by using this water treatment PPT slideshow. It is easy to present the key trends that will influence the water industry in the future such as increasing regulation, failing infrastructure, greater conservation, and efficiency, etc. Showcase the leading factors that will affect the performance of the water technology market by using content-ready water quality assurance PowerPoint visuals. You can edit water quality testing PPT themes to present the sources of water pollution. Highlight the natural processes and human processes that affect water quality. Provide an overview of the optimization of deterioration in water quality. You also can present the chemicals and biological pollutants that deteriorate the water quality. Showcase the water quality monitoring types and their objectives by downloading our visually attention-grabbing water quality monitoring PPT slides.
People who downloaded this PowerPoint presentation also viewed the following :
Content of this Powerpoint Presentation
Water, the magic potion of life, without which no living being can survive deserves the best conservation humankind can give it. But what should we do as the first step to safeguard it? Water quality assessment is the answer.
Monitoring water quality helps track sources of its pollution. Demonstration of water quality assessment is significant, so you can curate mitigation strategies to fight the pollution and ensure it does not create major problems.
Download our PPT template for Data Quality Assessment Metrics for Operational Records!!
If you desire to make a PPT slide, then you have come to the right place. SlideTeam has prepared some ready-to-use PPT slides for water quality assessment. You can outline elements essential in the process of checking water quality. We have created a slide deck with impressive and creative visuals, charts, and diagrams. You can edit the information, as each template is 100% editable and customizable.
Explore our 3P process for organizational quality assessment PPT slides!!
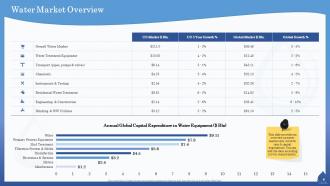
Template 1: Water Market Overview
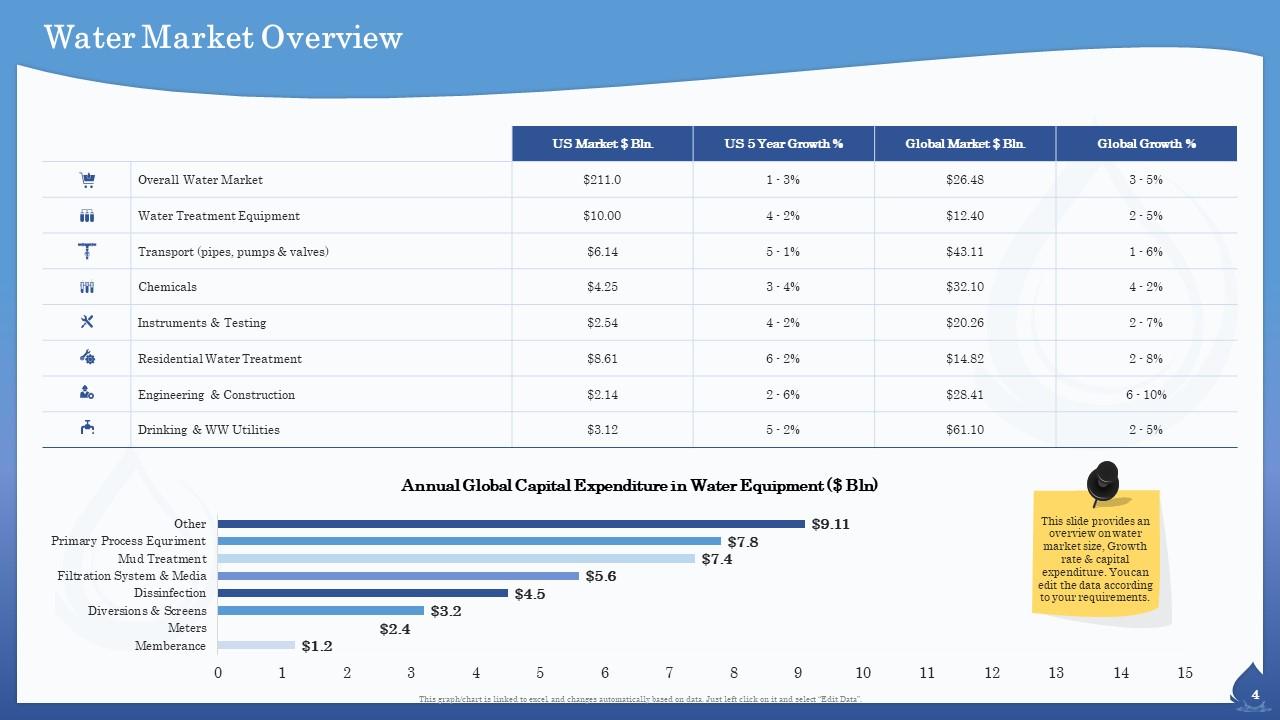
Create an outline of the water market with this PPT slide that also provides you with a ready-to-use chart with five columns and eight rows. Each row will demonstrate the water market, including water treatment equipment, transport, chemicals, instruments and testing, residential water treatment, engineering and construction, and drinking and utilities, along with their US market share, growth percentage, and global market.
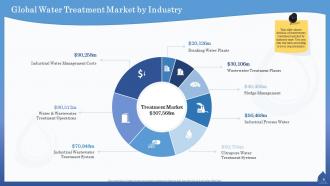
Template 2: Global Water Treatment Market by Industry
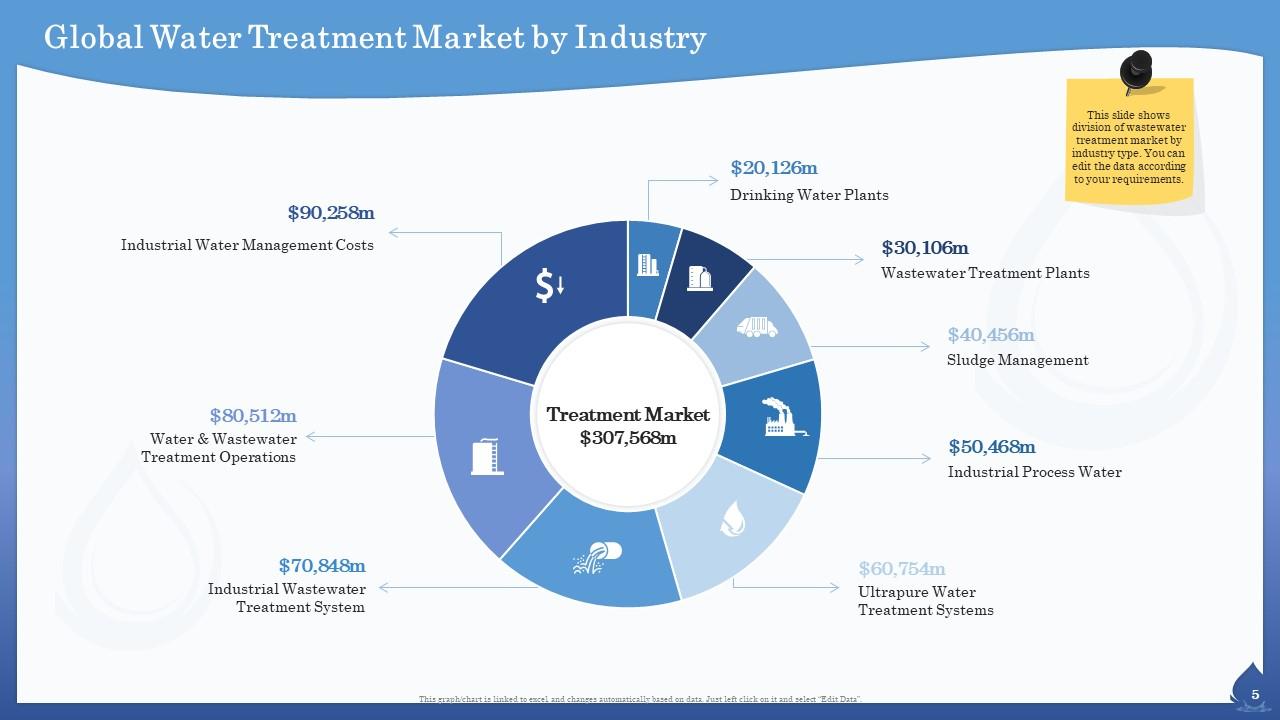
The water treatment market is vast, and this template helps you demonstrate it through their industries. The graph helps outline water treatment markets in industries like sludge management, water and wastewater treatment operations and industrial water management. Grab this particular slide to provide a brief outline of the global water treatment market.
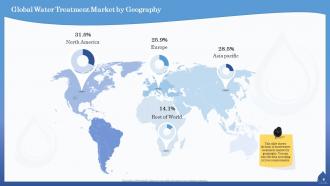
Template 3: Global Water Treatment Market by Geography
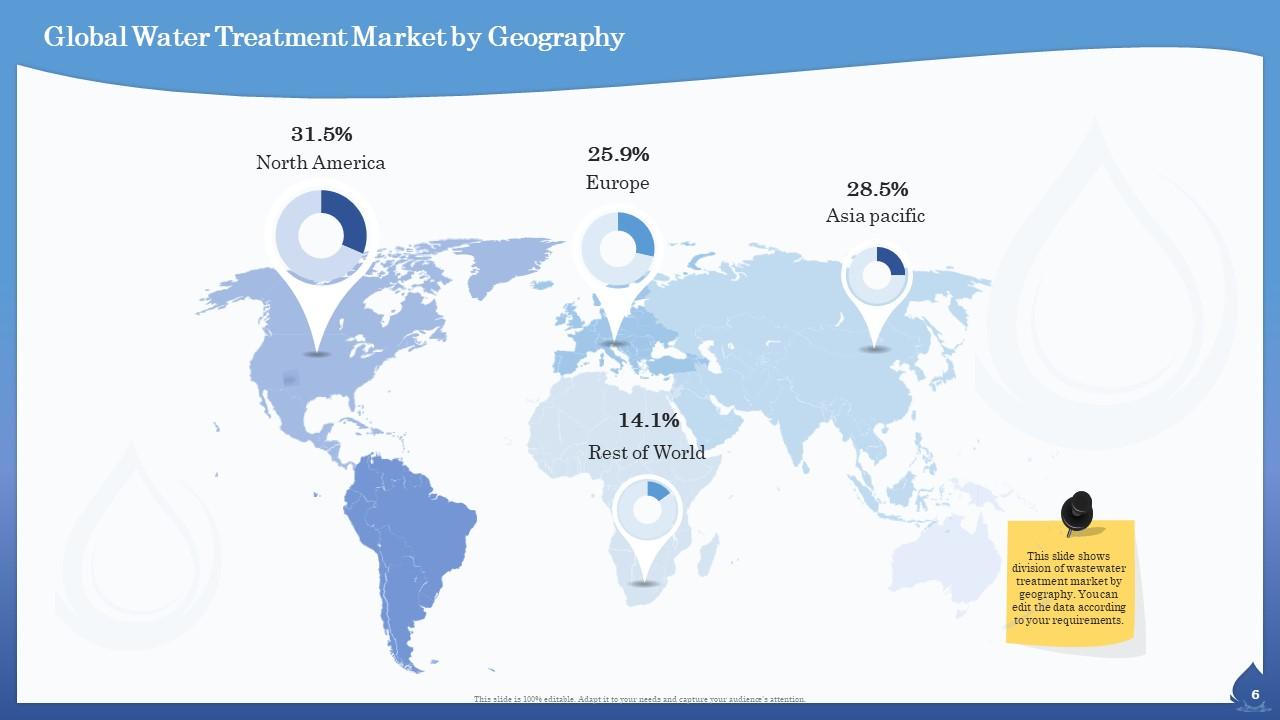
Demonstrate the global water treatment market according to their geographical location. This slide will highlight water treatment markets in areas of the world. For instance, you can illustrate water treatment across continents.
Template 4: Water Industry Key Statistics in the US
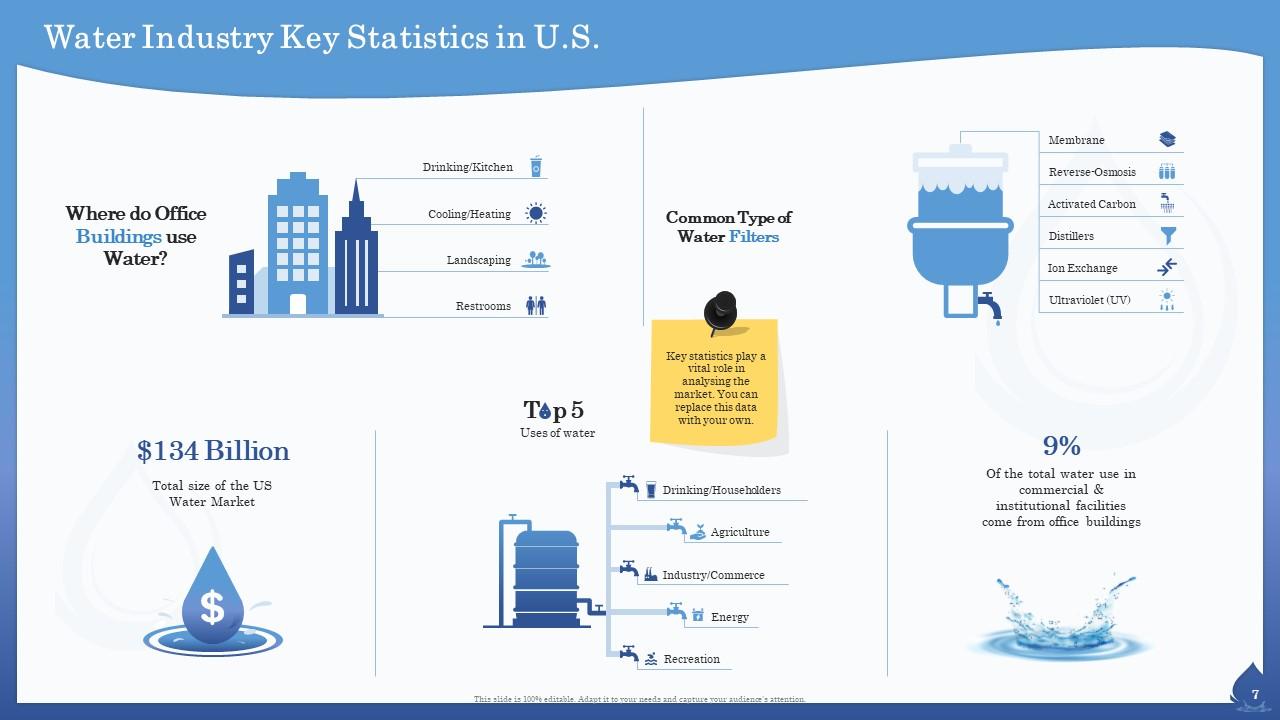
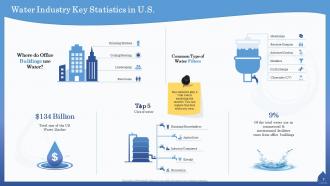
This slide is designed to help you outline the water industry's key statistics in any country. You can highlight the places where the water from office buildings goes, common types of water filters, the total size of the market, and the top uses of water through impressive visuals and graphics.
Template 5: Key Global Water Industry Statistics
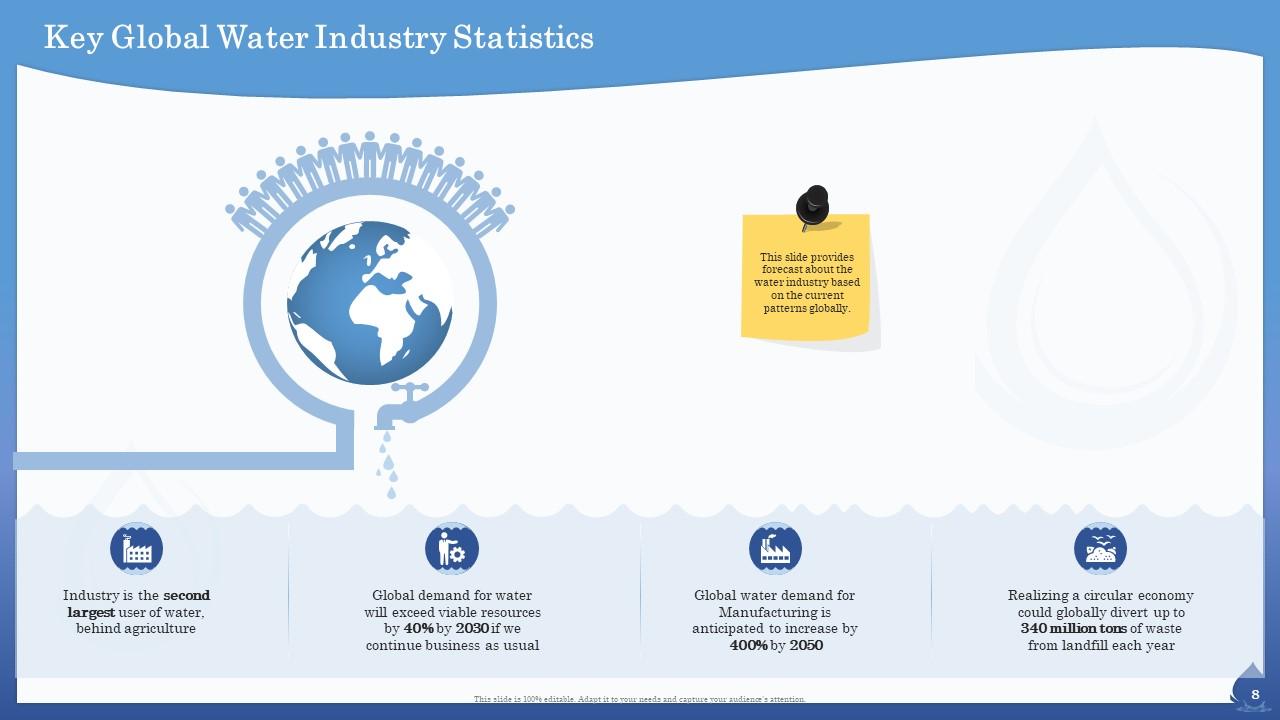
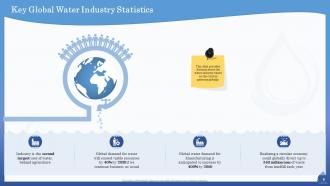
The global water industry is a giant one, and illustrating this is important if you are presenting a global water industry assessment; this template will help you outline that this industry is the second most extensive use of water and how the global demand for water exceeds viable resources through creative and innovative icons.
Template 6: Trends Influencing Water Industry
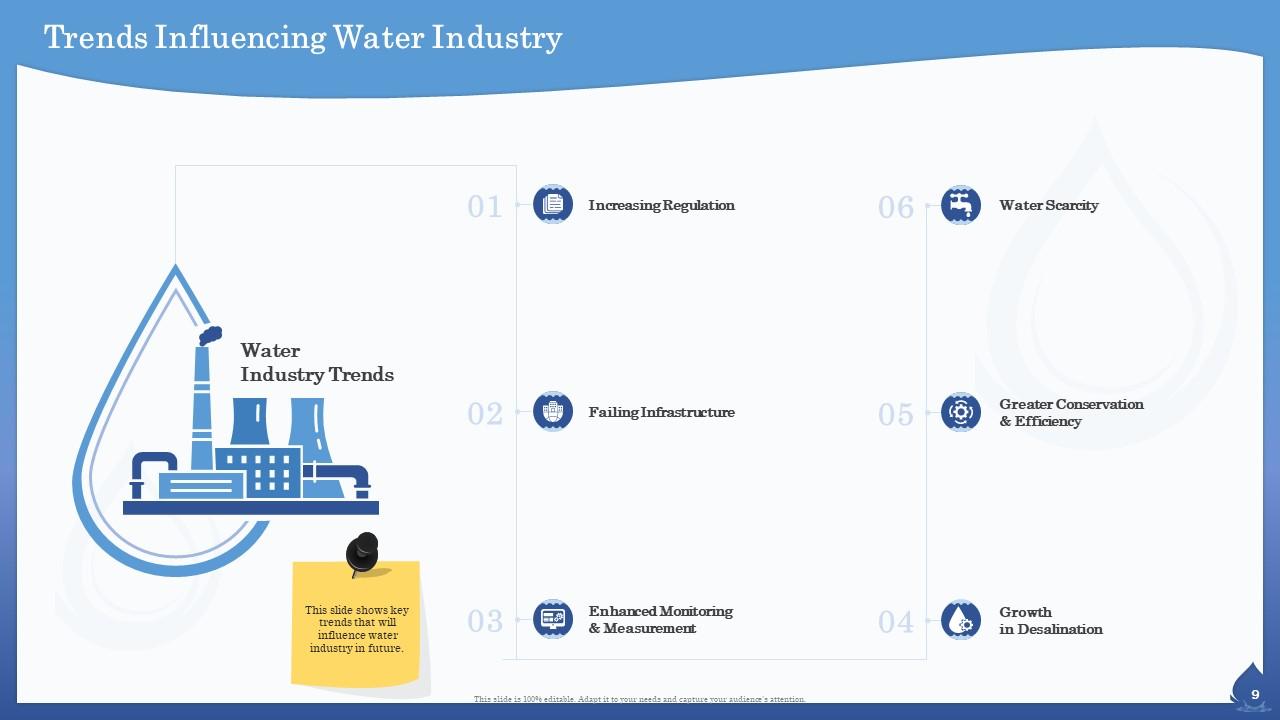
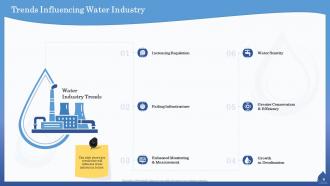
Outline the trends that influence the water industry through this PPT. You can define trends, such as increasing regulation, water security, failing infrastructure, growth in desalination, and enhanced monitoring and measurement. Grab this template to outline water industry trends.
Template 7: Water Industry Growth Drivers
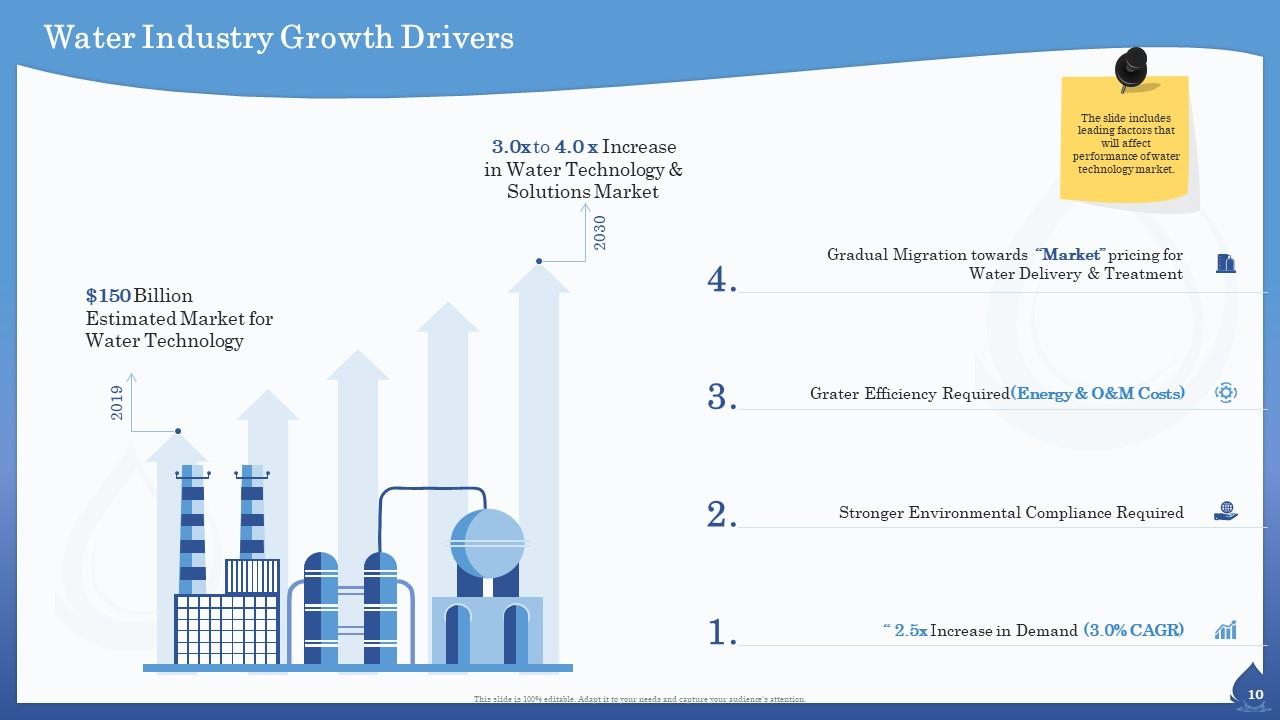
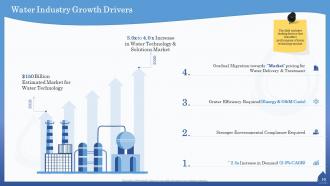
Some key drivers propel this essential sector towards significant growth. This template helps demonstrate the increase in demand for the growth of the water industry, pricing for water delivery and treatment, and efficiency required through graphics and creative visuals.
Template 8: Water Quality
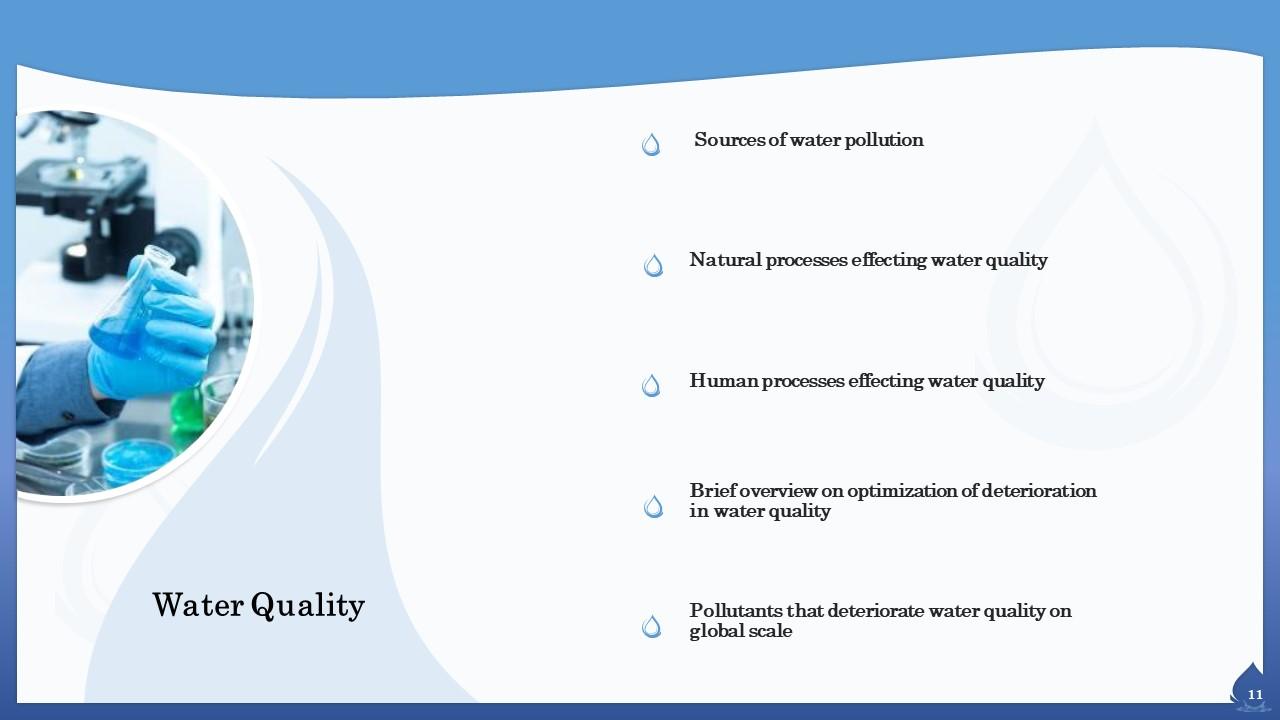
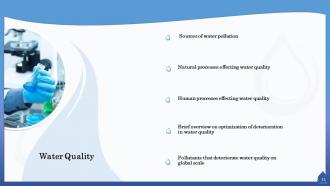
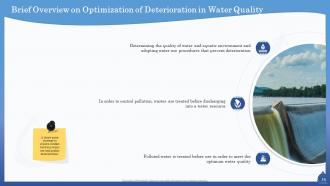
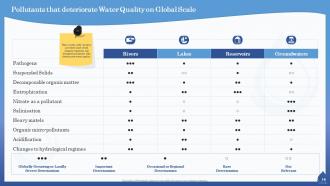
This particular template will help you demonstrate the factors that affect water quality. Through this slide, you can depict and study the sources of water pollution. Other than this, the slide will also provide an overview of the optimization of deterioration in water quality and pollutants that are responsible on it in a global scale.
Template 9: Sources of Water Pollution
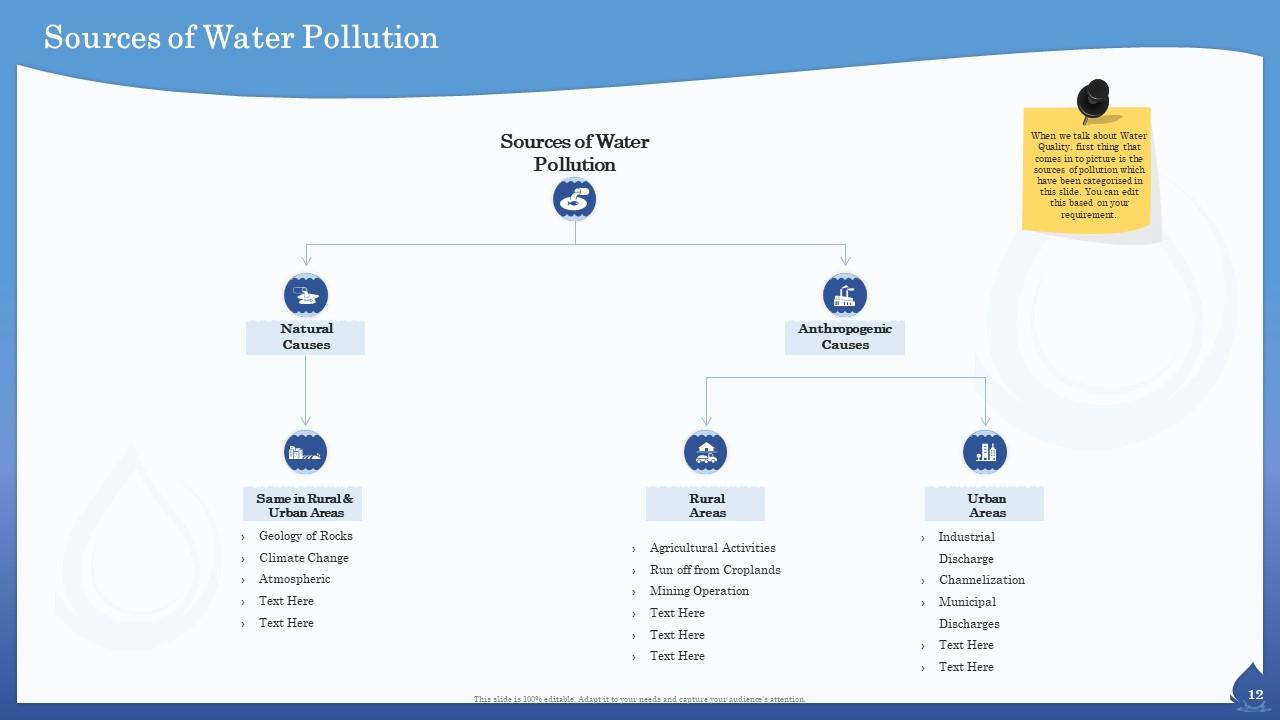
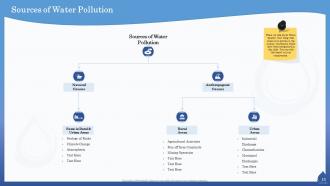
Highlight the sources of water pollution using this template and a flow chart. You can shed light on the factors that can cause pollution, such as natural causes. This template will provide you the opportunity to mention more factors that cause pollution, and also in rural & urban areas. Grab the opportunity to outline the factors that cause pollution through a flow chart.
Template 10: Natural Processes Effecting Water Quality
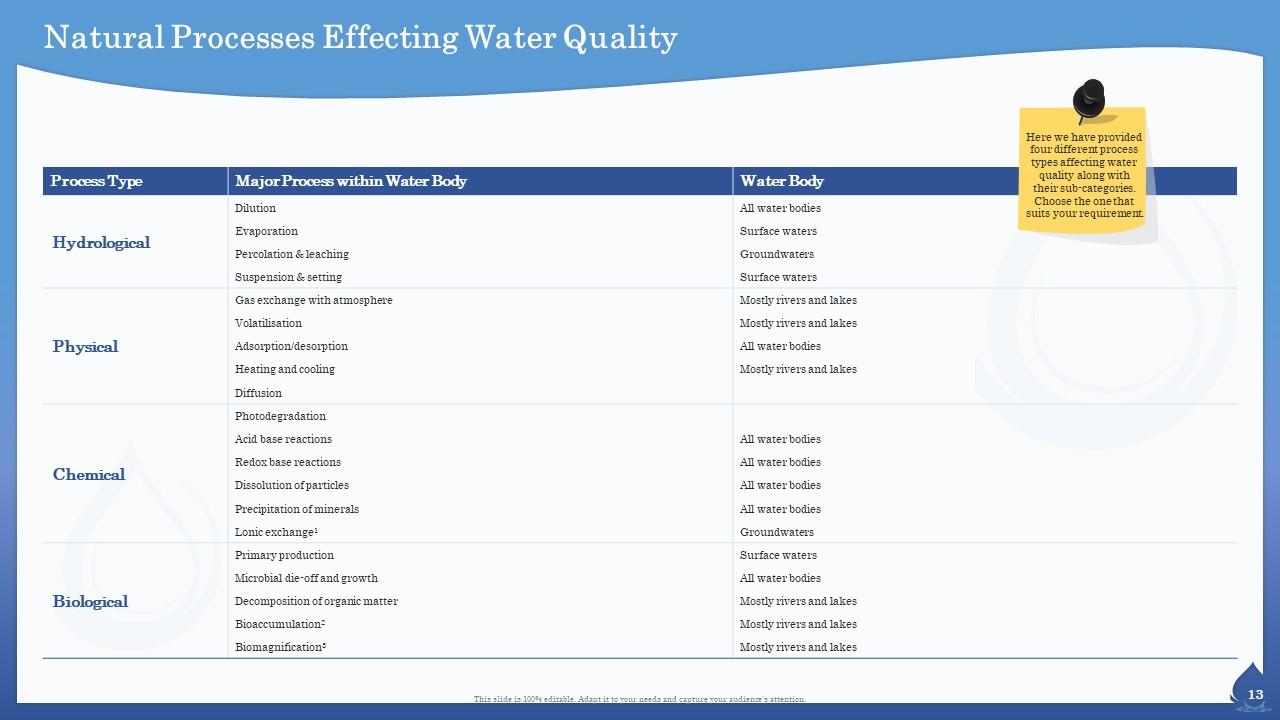
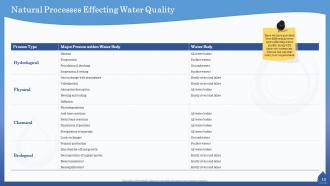
Create a chart to demonstrate the natural processes which affect water quality. Highlight the process types and major processes within water bodies that impact the quality of water. This slide helps you provide information on the processes that affect water quality through a flow chart.
MAINTAINING WATER QUALITY CRITICAL
Water resources are vital, and maintaining their quality is essential for human and environmental health. The assessment, as done through the complete deck, will identify critical areas and help you demonstrate them according to the data you fill in. Grab these templates for better Water Quality Assessment PowerPoint Presentation Slides.
P.S. Download our PPT slides if you want to present Business quality assessment framework with feedback loop!
Water quality assessment powerpoint presentation slides with all 76 slides:
Use our Water Quality Assessment Powerpoint Presentation Slides to effectively help you save your valuable time. They are readymade to fit into any presentation structure.




FAQs for Water quality assessment
Start with pH and dissolved oxygen - those are your bread and butter. Temperature and turbidity round out the basics. Monthly testing works for most water sources, though you might need more if there's sketchy stuff upstream. Nitrogen and phosphorus will show you nutrient problems, plus E. coli for any nasty contamination. Oh, and conductivity is actually pretty clutch even though people sleep on it - tells you about dissolved solids. Heavy metals matter if you're anywhere near industry. Honestly just grab a basic test kit first. You can always add more tests once you see what's going on.
So pH measures if your water's acidic or basic, and fish are super picky about it. They need that 6.5-8.5 range or they'll get stressed and sick. Acidic water can actually eat away at their gills - pretty brutal stuff. Basic water makes ammonia way more toxic, which is bad news. I've watched whole lakes go to hell when the pH crashed! You should test it with temperature and oxygen levels since they all affect each other. Oh, and if your numbers look weird, check what's happening upstream first.
So heavy metals are basically the big red flags for water contamination - lead, mercury, cadmium, all that nasty stuff. They don't break down naturally and just keep building up in your system over time, which is why even tiny amounts matter. The annoying thing is that "safe" levels totally depend on what you're using the water for. Drinking water? Super strict limits. Watering crops? Way more relaxed standards. You'll need really precise testing since we're talking trace amounts here. Just make sure you're checking against the right guidelines for whatever you're actually doing with the water - I've seen people mess that up before.
So basically macroinvertebrates are like little water quality indicators - you find different bugs depending on how clean the stream is. Mayflies and caddisflies? Your water's in great shape. Only seeing worms and midge larvae means there's probably pollution upstream. Honestly I was skeptical at first but it actually works really well. You don't even need fancy lab stuff, just collection containers and ID guides. Oh and definitely sample multiple spots both upstream and downstream from wherever you think contamination might be coming from - gives you way better data than just one location.
Nitrogen and phosphorus are the big culprits - mostly from farm runoff and sewage. E. coli shows up from animal waste, heavy metals come from industrial stuff. Construction sites dump tons of sediment too. Pharmaceuticals in water are honestly pretty wild when you think about it. Microplastics are everywhere now. Pesticides and oil/grease wash off roads and parking lots. Here's what I'd do - check out the land use around where you're sampling first. Farms nearby? Expect nutrients. Industrial area? Look for metals. It's like a cheat sheet before your lab results come back.
So basically nitrates and phosphates act like plant food for algae and aquatic plants. Too much of either one triggers crazy algal blooms. Those blooms suck up all the oxygen when they die off, which creates dead zones - fish literally can't survive there. Phosphates are usually what limits growth in lakes and rivers, but nitrates are the big problem in ocean water. I'd definitely keep an eye on both though, honestly even tiny spikes can flip an entire ecosystem and good luck fixing that mess once it starts.
So for water sampling, grab samples work fine for surface water, but groundwater's a pain - you'll need to pump from monitoring wells. The actual testing part is usually easier than getting good samples, honestly. You'll want spectrophotometry for nutrients, ion chromatography for the major ions, plus membrane filtration if you're checking for bacteria. Oh, and definitely measure pH, dissolved oxygen, and conductivity right there in the field since those change fast. Chain of custody paperwork is annoying but don't skip it, and watch those lab holding times or you'll have to resample everything.
Ugh, climate change is totally screwing up water testing right now. Temps are higher so you get way more algae blooms and bacteria. Then there's the crazy weather - either massive floods or droughts that mess with contaminant levels in ways nobody can predict. Your old seasonal sampling schedule? Pretty much useless at this point since "normal" doesn't exist anymore. Oh, and if you're near the coast, saltwater's creeping into freshwater sources too. Honestly, I'd start tweaking your monitoring plans now and maybe test for more stuff than usual.
So basically, whatever's happening on land upstream totally messes with water quality. Farms are the worst offenders - all those fertilizers and pesticides just wash straight into streams and create nasty algae blooms. Cities aren't much better though. All that pavement means stormwater picks up oil, chemicals, random trash, you name it. Trees actually do the heavy lifting when it comes to filtering out pollutants naturally, which is why cutting them down sucks. Oh and industrial areas? They're leaking heavy metals and toxic crap all the time. Pro tip: always check what's upstream first - it'll save you tons of guesswork about contamination.
Honestly, the coolest stuff happening right now is IoT sensor networks and optical sensors. Companies are dropping smart buoys everywhere that detect pH, heavy metals, you name it - all in real-time. Optical sensors are wild because they use light wavelengths to spot contaminants without sending anything to a lab. Machine learning can even predict problems before they hit by watching your data patterns. Oh, and AI analytics platforms are getting scary good at this stuff. If you're upgrading, definitely look at Hach or YSI's wireless packages first. They've gotten way cheaper and actually make sense to use now.
Honestly, getting the community involved in testing their own water is way better than having some government agency swoop in once a year. People actually care more when it's their responsibility, you know? They'll spot problems faster too since they're checking regularly. Plus locals already know all the weird seasonal stuff - like when the creek gets funky after heavy rains or whatever. You just need to train them properly and give them decent testing equipment that won't break. Otherwise the data becomes useless. It's pretty smart actually - you get way more coverage and people who are genuinely invested in keeping their water clean.
Cities are brutal - you've got industrial stuff, storm drains, and pollution sources changing constantly throughout the day. The infrastructure's so complex that contamination could literally be coming from anywhere. Rural spots seem easier but they're not really. Agricultural runoff is all over the place depending on the season, there's way fewer places to actually monitor, and getting to those remote sites? Total pain. Oh and timing matters everywhere, just for completely different reasons. Honestly I'd just focus your sampling plan around whatever pollution patterns you think you'll see in each area.
So basically the government sets legal limits on how much contamination can be in water and makes everyone test it regularly. Laws like the Clean Water Act force cities to treat water properly and stop factories from dumping nasty stuff. Pretty smart system honestly - without it, companies would just cut costs and screw over public health. There's penalties if you don't follow the rules too. Both federal and state have different requirements depending on what you're doing, so definitely check what applies to your situation first. It's way more detailed than most people realize.
Honestly, getting communities involved is like having a massive network of free monitors everywhere. Regular people spot pollution way faster than any official agency could - they're already out there living near the water. You set up easy reporting systems and teach folks what warning signs to watch for. Here's the thing though: people actually give a damn about protecting their local water once they understand the impact. Oh, and definitely follow up when someone reports something - otherwise they'll stop bothering to help. Citizen science programs work great too for basic data collection.
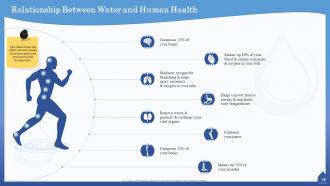
Your water quality matters way more than most people think - you're drinking whatever's in there, good or bad. Contaminated stuff can mess with your stomach right away or cause serious long-term problems from chemicals and metals you can't even see. Clean-looking doesn't mean clean, unfortunately. I've seen links to kidney issues and developmental problems in kids. If you've got well water, definitely test it regularly. Municipal water? Check those quality reports they send out. Honestly, a decent filter isn't a bad investment either way.
-
Appreciate the research and its presentable format.