

0714 caribbean region powerpoint maps showing bahamas haiti etc




Try Before you Buy Download Free Sample Product
 Impress Your
 Audience
 100%
100% Editable
 Save Hours
 of Time


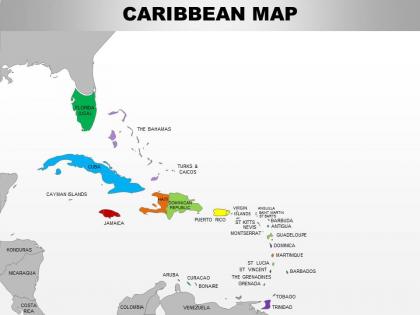
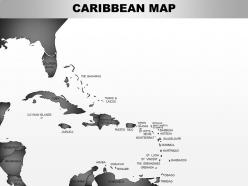
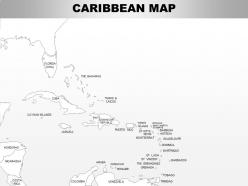
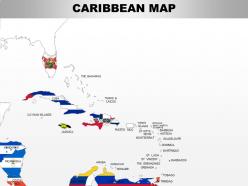
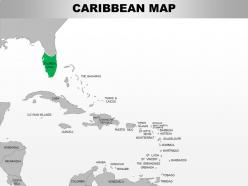
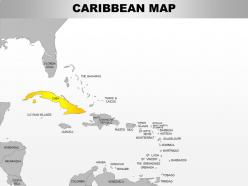
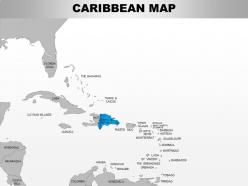
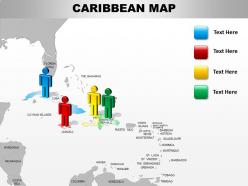
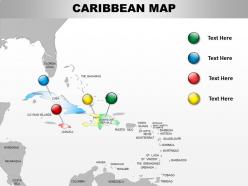
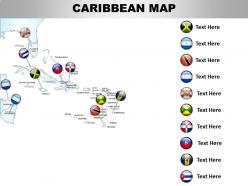
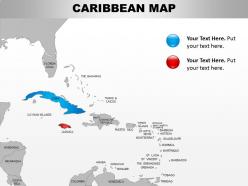
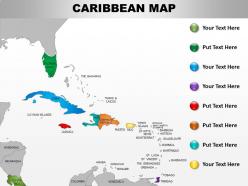
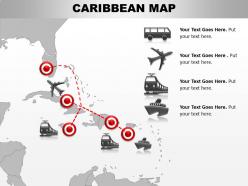
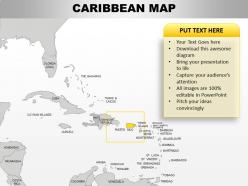
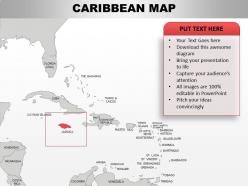
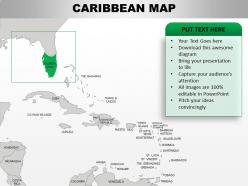
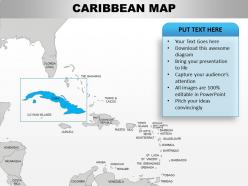
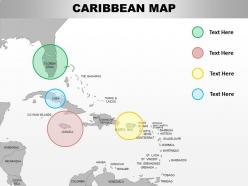
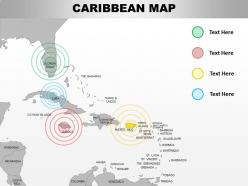
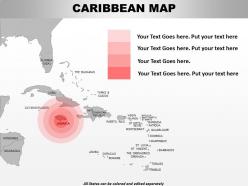
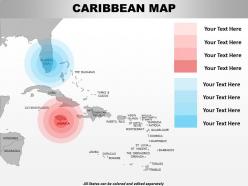
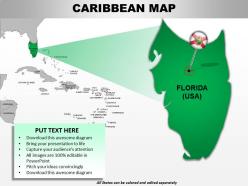
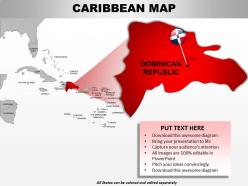
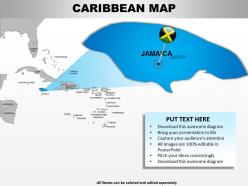
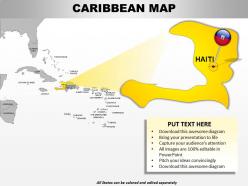
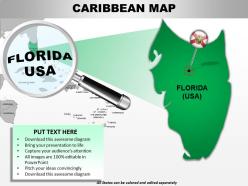
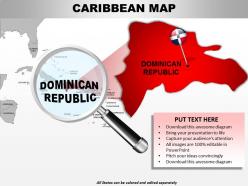
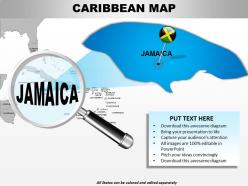
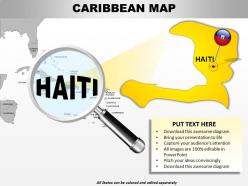
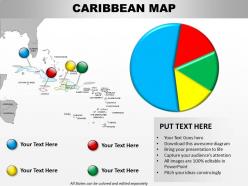
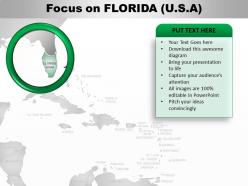
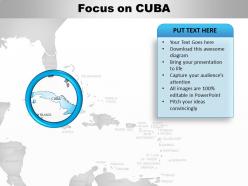
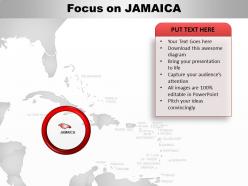
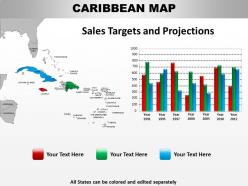
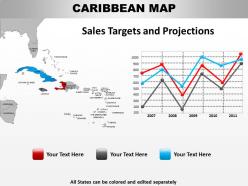
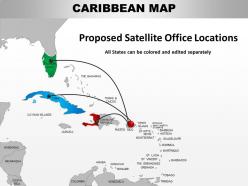
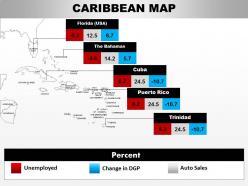
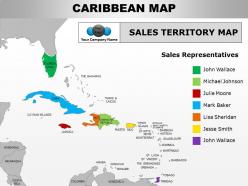
Present the geographical aspects of your business with 0714 Caribbean Region PowerPoint Maps showing Bahamas Haiti etc. This PPT template icon uses a Caribbean region map in the slide icon which can be used by the presenter to showcase the business prevailing or business targets to be achieved in this specific region. This PPT graphic shows Bahamas Haiti in the slide template which can be useful if in case you are looking forward to present this particular geographical region to your audience. This is one of the interactive maps used in the presentation slide. Representing locations for your business definitely fetch the attention of viewers which means this design if used to present the relevant PPT icon can prove to be an exponential presentation design for the audience and is sure to attract people due to its concept and use of innovating image of that of Caribbean region displaying Brahmas Haiti in the slide design. Make them feel competent with our 0714 Caribbean Region Powerpoint Maps showing Bahamas Haiti Etc. Build up their faith in their ability.
People who downloaded this PowerPoint presentation also viewed the following :
0714 caribbean region powerpoint maps showing bahamas haiti etc with all 48 slides:
Acknowledge the desire for change with our 0714 Caribbean Region Powerpoint Maps showing Bahamas Haiti Etc. Convince them of your adaptable approach.

FAQs for 0714 caribbean region powerpoint maps showing
Caribbean region maps primarily represent island archipelagos, coral reefs, volcanic mountains, tropical coastlines, and major shipping routes connecting the Atlantic Ocean, Caribbean Sea, and Gulf of Mexico. These geographical features help businesses in tourism, shipping, and resource extraction industries plan strategic operations, with many hospitality companies and maritime organizations finding that detailed topographical data enhances operational efficiency and customer experiences.
Political boundaries in Caribbean maps reveal centuries of colonial transitions, independence movements, territorial disputes, and administrative reorganizations that have shaped the region's governance structure. These cartographic elements demonstrate how islands transitioned from Spanish, British, French, and Dutch colonial control to independent nations, with many territories like Puerto Rico and Martinique maintaining special relationships with former colonial powers, ultimately reflecting the complex geopolitical evolution.
Topographic maps reveal the Caribbean's diverse terrain through elevation contours, slope gradients, coastal formations, volcanic features, and watershed patterns. These detailed representations enable urban planners, tourism developers, and environmental scientists to assess land suitability, infrastructure placement, and natural hazard zones, with many island governments finding that topographic analysis streamlines development planning and disaster preparedness across their varied landscapes.
Climate maps of the Caribbean illustrate climate change impacts by showing rising sea surface temperatures, altered precipitation patterns, intensified hurricane corridors, coral reef bleaching zones, and coastal vulnerability areas. These visualizations enable governments, tourism operators, and agricultural sectors to identify risk zones, plan adaptive infrastructure, and develop resilient strategies, with many island nations finding that comprehensive climate mapping ultimately delivers more effective disaster preparedness and sustainable development planning.
Physical Caribbean maps display natural features like mountain ranges, ocean depths, coral reefs, volcanic islands, and climate zones, while political maps show territorial boundaries, capital cities, dependencies, and governmental jurisdictions. These complementary mapping approaches enable businesses, researchers, and organizations to analyze both geographical constraints and political frameworks when developing regional strategies, with many multinational companies finding that combining both perspectives enhances market analysis and operational planning.
Thematic maps effectively depict Caribbean demographic information through color-coded population density visualizations, age distribution overlays, migration pattern indicators, and economic classification systems. These mapping techniques enable governments, researchers, and businesses to analyze regional trends, identify development opportunities, and make strategic decisions, with many Caribbean nations finding that visual demographic data enhances policy planning and resource allocation efforts.
Cartographers face significant challenges including varying island scales, complex coastal geometries, frequent boundary changes, limited survey data, and hurricane-induced topographical shifts. These difficulties are compounded by the region's diverse political jurisdictions and inconsistent datum systems, with many mapping organizations finding that satellite imagery and GPS technology increasingly help streamline accuracy while reducing traditional surveying costs.
Marine maps contribute to understanding Caribbean ecological diversity by visualizing coral reef distributions, marine protected areas, biodiversity hotspots, ocean currents, and species migration patterns. These detailed cartographic tools enable marine biologists, conservationists, and policymakers to identify critical habitats, track environmental changes, and develop targeted protection strategies, ultimately delivering enhanced conservation outcomes and sustainable marine resource management across this ecologically rich region.
Tourist maps significantly influence Caribbean travel by showcasing key attractions, beaches, cultural sites, and transportation routes, while helping visitors navigate between islands and plan efficient itineraries. These visual tools enhance destination marketing by highlighting unique experiences like diving spots, historical landmarks, and local festivals, ultimately driving tourism revenue and encouraging longer stays across multiple Caribbean territories.
Historical Caribbean maps reveal colonial territorial claims, plantation distributions, port locations, shipping lanes, and resource exploitation patterns across different European powers. These cartographic records enable researchers, educators, and policy makers to understand how Spanish, British, French, and Dutch influences shaped island economies, cultural exchanges, and strategic maritime networks, ultimately delivering comprehensive insights into regional development patterns and modern geopolitical relationships.
Modern Caribbean region mapping utilizes GIS software like ArcGIS and QGIS, satellite imagery from Landsat and Sentinel, GPS technology, LiDAR scanning, and drone surveying capabilities. These technologies streamline data collection, enhance spatial accuracy, and deliver comprehensive geographic insights, with many government agencies and tourism organizations finding that integrated mapping solutions ultimately provide better resource management and strategic planning advantages.
Maps enhance our understanding of Caribbean cultural diversity by visualizing language distributions, religious practices, ethnic compositions, colonial histories, and migration patterns across different islands. Through color-coded cultural overlays and demographic data, educators, researchers, and policymakers can identify cultural clusters, trace historical influences, and understand how geography shaped distinct island identities, ultimately delivering deeper insights into this remarkably diverse regional tapestry.
Maritime boundaries in Caribbean maps define exclusive economic zones where nations control fishing rights, resource extraction, and commercial activities up to 200 nautical miles offshore. These boundaries enable countries like Jamaica, Barbados, and Trinidad to manage their fisheries sustainably, regulate international fishing vessels, and protect local fishing communities, while ultimately delivering food security and economic opportunities in an increasingly competitive regional market.
Digital mapping platforms enhance accessibility to Caribbean geographic information by providing real-time data visualization, interactive features, multilingual support, and mobile-responsive interfaces that eliminate traditional barriers. Through cloud-based technologies, tourism operators, government agencies, and research institutions streamline navigation services, disaster preparedness planning, and environmental monitoring across the archipelago, while delivering cost-effective solutions and improved user experiences for both residents and visitors.
Earthquakes and volcanic activity significantly impact Caribbean mapping by requiring constant updates to topographical features, coastal boundaries, and infrastructure layouts, while creating both challenges and opportunities for cartographers. Through satellite monitoring and seismic tracking technologies, mapping organizations continuously revise elevation data, shoreline changes, and hazard zones, ultimately delivering more accurate risk assessment tools and emergency response maps for island nations and coastal communities.
-
Innovative and Colorful designs.
-
Appreciate the research and its presentable format.