


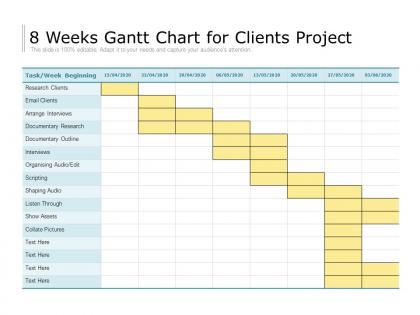
8 weeks gantt chart for clients project




Try Before you Buy Download Free Sample Product
 Impress Your
 Audience
 100%
100% Editable
 Save Hours
 of Time


Inject a feeling of fun with our 8 Weeks Gantt Chart For Clients Project. Convert the grind into an enjoyable experience.
People who downloaded this PowerPoint presentation also viewed the following :
8 weeks gantt chart for clients project with all 2 slides:
Convert the grind into an enjoyable experience with our 8 Weeks Gantt Chart For Clients Project. It injects a feeling of fun.
FAQs for 8 weeks gantt chart
So a Gantt chart is just a timeline where you map out all your project tasks as horizontal bars. Shows when stuff starts, when it ends, and how everything connects. Really helpful for spotting which tasks depend on others or if things overlap weirdly. I honestly think they're one of the better ways to keep teams from getting confused about deadlines. You can track progress, catch bottlenecks early, and show stakeholders what's actually happening. If you're running behind, it's super obvious. Start basic with your main tasks and dates - don't overthink it at first.
Honestly, Gantt charts are a game changer for keeping teams organized. They show everyone's tasks on a timeline so nobody's confused about deadlines or who's handling what. The cool part is seeing how different tasks connect - like if Sarah's behind on research, you'll know it affects Mike's presentation next week. Updates are key though, otherwise they're just pretty charts gathering dust. Your manager will probably love having something visual to point at during meetings (mine definitely does). I'd start small with your next project and just map out the main pieces. You'll be shocked how much mental clutter it clears up.
Okay so Gantt charts are actually pretty straightforward once you get them. Tasks go down the left side, then you've got these horizontal bars stretching across a timeline at the top. Each bar shows start date, duration, and when stuff wraps up. The connecting lines between tasks? Those show dependencies - like you can't paint the wall before you build it, you know? Timeline's usually dates or weeks depending on how big your project is. Most charts throw in diamond shapes for milestones and some kind of progress tracking. Honestly the key is just mapping out your main tasks first and figuring out what depends on what.
Honestly, start with figuring out your team size and budget first. Got simple projects? GanttProject or Excel templates work fine and won't cost you anything. Cloud stuff like Asana or Monday.com is clutch if your team needs to collaborate - I'm slightly obsessed with how smooth the real-time updates are. Microsoft Project's still the beast for complex enterprise work with tons of dependencies, though it's overkill for most people. Oh, and don't stress too much about picking the "perfect" one. Grab free trials of 2-3 options and test them on actual projects. You'll know pretty quick which one doesn't make you want to throw your laptop.
Gantt charts are basically timelines with those bar thingies showing when stuff starts and ends - plus how tasks connect to each other. Kanban boards are different. They're more about moving work through stages like "To Do" and "Done" without getting overwhelmed. Honestly, Gantt charts work better when you're planning something complex with lots of dependencies. Kanban's great for day-to-day workflow stuff where you need to spot bottlenecks quickly. Really depends on whether you're mapping out a whole project upfront or just trying to manage your current workload better.
Yeah, totally! Just swap out the columns and phases for whatever makes sense in your field. Construction folks track permits and material deliveries. Software teams do sprints and code reviews. Marketing? Content creation, approvals, launch dates - you get it. I actually know someone who used one for their wedding (which honestly worked pretty well). The trick is figuring out your critical milestones first. What are the big moments that can't be delayed? Build around those dependencies. Start with your most important phases, then fill in the details from there.
Honestly, most people just throw way too much stuff on there and it turns into a hot mess. Keep it focused on the big milestones instead of every tiny task. Dependencies are huge though - when one thing gets delayed, everything else falls apart like dominoes. I've seen it happen so many times. Update it regularly too, because an outdated Gantt chart is basically worthless. Don't treat it like some sacred document that can't change. Simple approach works best - track what matters, keep it current, and you're golden.
Yeah, most Gantt tools these days connect pretty well with whatever you're already using. APIs, direct integrations, file imports - the usual stuff. Your tasks can sync automatically between the Gantt tool and things like Jira, Trello, or Asana, which honestly saves so much time. Some even let you drop live Gantt views right into your dashboards or company wiki. I'd start by seeing what your current PM tool already connects to - might save you some headaches down the road. Then find a Gantt tool that fits into that ecosystem instead of fighting against it.
Yeah, Gantt charts are honestly pretty great for this stuff. They show you everything at once - what's on track, what's falling behind, upcoming deadlines. It's like having your whole project laid out visually instead of buried in some messy spreadsheet (which I used to do and it was terrible). Bottlenecks become super obvious when you can see the timeline like that. Plus they're perfect when you need to update your boss or client without getting into all the nitty-gritty details. Just update yours weekly so it doesn't become useless. Trust me on that one.
Dude, you should totally try Gantt charts instead of regular timelines. They show how all your tasks connect to each other, which is clutch when one thing gets delayed and screws up everything else. Basic timelines just show start/end dates, but Gantt charts let you see resource allocation and spot problems before they blow up. Honestly, they're way better for explaining stuff to your boss too since everything's visual. I learned this the hard way on my last project - wish I'd switched sooner! If you've got multiple things happening at once, the Gantt view will make your whole roadmap so much clearer.
You'll want to use arrows connecting your task bars - that's how you show what needs to happen before what. Most tools let you just drag lines between tasks to link them up. The standard one is finish-to-start (Task A wraps up before Task B kicks off), though you can do start-to-start too depending on your software. Here's the thing though - don't go nuts connecting every single task or it looks like spaghetti. Just focus on the dependencies that would actually mess up your timeline if something went wrong. Oh, and color-coding different types helps if your tool does that.
I'd update it weekly bare minimum, but daily is way better when things are moving fast. Your team knows what's actually happening better than you do, so get them involved in updates. Track real progress against your milestones and adjust task times based on actual data - don't just push dates around hoping it'll magically work out (learned that one the hard way). Dependencies will shift when scope changes, that's just life. The key thing though? Tell stakeholders about delays the second you see them coming. Oh, and set a calendar reminder or you'll totally forget to check it regularly.
Yeah, Gantt charts are actually pretty flexible when scope changes - you can drag and drop new tasks, extend deadlines, whatever. Tools like Monday and Asana make it dead simple. Just watch out for dependencies though! Add one task and suddenly three others get pushed back. Trust me, learned that one the hard way last month. You'll definitely want to tell your team right away about changes. Oh, and color-coding new stuff is clutch so people can spot updates quickly. Way better than having everyone confused about what shifted.
Oh man, Gantt charts are actually pretty solid for tracking stuff! You can see your project duration, spot the critical path, and check how your resources are being used. Timeline slippages jump out at you way faster than digging through spreadsheets - trust me on that one. Dependencies between tasks become super obvious too. I'd honestly set up quick weekly reviews with your team, maybe just 10 minutes. You'll catch bottlenecks and scheduling conflicts before they mess everything up. Plus tracking milestones and comparing what actually happened vs what you planned? Game changer.
Okay so Gantt charts are actually really useful for this stuff. They show you exactly who's doing what and when, which helps you catch conflicts early. Like if Sarah's got three deadlines the same week - you'll see that mess coming. Dependencies are super clear too, so you know the design has to wrap before developers can jump in. I probably sound like a total project nerd, but honestly these charts prevent so many "oh crap, nobody's handling this" situations. Try the color-coding thing by team - makes everything way easier to scan quickly.
No Reviews