


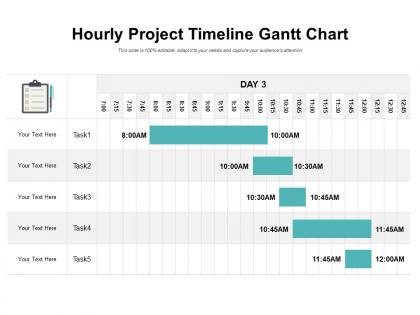
Hourly project timeline gantt chart




Try Before you Buy Download Free Sample Product
 Impress Your
 Audience
 100%
100% Editable
 Save Hours
 of Time


Address insatiable demands with our Hourly Project Timeline Gantt Chart. Cater for any information that could be asked for.
People who downloaded this PowerPoint presentation also viewed the following :
Hourly project timeline gantt chart with all 2 slides:
Cater for any information that could be asked for with our Hourly Project Timeline Gantt Chart. It helps address insatiable demands.
FAQs for Hourly project
You'll need tasks down the left side and a timeline running across the top. Horizontal bars show when each task starts and ends. Dependencies are crucial - those arrows connecting tasks that can't start until others finish. They look like spaghetti sometimes but trust me, you need them to catch problems early. Drop in some diamond-shaped milestones for big deadlines. Assign owners to everything so people know what's theirs. If your software does progress tracking, throw that in too. My advice? Start basic and build from there once everyone gets used to reading these things.
Dude, Gantt charts are game changers. You get this visual timeline showing when everything happens - no more guessing if you're behind schedule. Dependencies become super obvious (like, task B can't start until A is done), and honestly? Explaining project status to your boss gets so much easier when you have a pretty chart instead of boring spreadsheets. Your team will actually see how their stuff connects to everyone else's work. I was skeptical at first but now I'm obsessed. Just grab any simple tool and try it on your next project - you'll be kicking yourself for waiting so long.
Honestly, the two big killers are overcomplicating everything and then never updating the damn thing. Don't cram a million tiny tasks in there - it becomes this unreadable mess. Time estimates? Yeah, we're all way too optimistic about those. I learned this the hard way when my timeline was basically fiction lol. Dependencies are huge too - forget about how tasks connect and your dates will be completely off. Oh, and here's the thing nobody mentions: you actually have to maintain it. Set a weekly reminder or whatever works, otherwise you're just looking at outdated info that doesn't help anyone.
Yeah, you can totally sync Gantt charts with other project tools - it's actually pretty smooth now. Most integrate directly with stuff like Jira, Trello, Asana, and Slack. I've found it works best when you use the Gantt as your main visual timeline but let the other tools do what they're good at. You can also hook them up to time tracking apps and budget systems, which is handy. Honestly, I'd start by figuring out what tools your team's already glued to, then find a Gantt solution that plays nice with those. Way easier than forcing everyone to switch platforms.
Honestly, Gantt charts are perfect when you've got a million things happening at once - like construction projects, software launches, or planning events. They shine when tasks depend on each other, you know? Like when Task A has to finish before Task B can even start. Multiple team members juggling different pieces? That's where these charts become clutch. I've seen them save people's butts on tight deadline projects because you can actually see bottlenecks coming. But if you're just doing something simple with a few random tasks, you're probably overthinking it with a Gantt chart.
Honestly, Gantt charts are like having a shared roadmap for your whole team. Everyone sees who's doing what and when stuff's due. Projects feel way less chaotic when people actually know what's happening around them, you know? The timeline thing makes it dead simple to catch bottlenecks or spot when someone's about to blow a deadline that'll wreck everyone else's schedule. Real-time updates keep the team synced without those soul-crushing status meetings we all hate. Just make sure people actually check it regularly - otherwise you're just making pretty charts for no reason.
Dude, so many ways to do this! Microsoft Project is like the fancy option if your work will pay for it - super powerful but honestly might be too much. I'd probably just start with whatever you're already using for projects since most tools have Gantt stuff now. Asana and Monday.com are pretty solid, Trello too. You could even hack something together in Google Sheets or Excel if you're feeling ambitious (though that's kinda a pain). Oh, Smartsheet's nice too - not as intimidating as Project but still does everything you need.
Yeah, Gantt charts can totally work with agile - just don't try mapping your whole project upfront like traditional teams do. Use them for sprint planning instead. They're great for showing dependencies between stories and tracking progress within your current sprint. The trick is staying flexible and updating them constantly when priorities change (which happens... a lot). Honestly, stakeholders eat this stuff up since they love seeing visual timelines. I'd stick to planning maybe 2-3 sprints ahead tops, then see how it's working for your team.
Honestly, weekly check-ins are your best bet here. Track how you're doing against your original guesses (because let's face it, that's what estimates really are). Update your completion percentages and shift dates when needed. But here's the thing - don't just shuffle dates around randomly. Figure out WHY stuff got delayed so you can catch patterns early. Your PM tool probably has time tracking features, so use those to compare planned vs actual hours. Oh, and shoot your team a quick update whenever you change the timeline. Nobody likes surprise deadline shifts.
Dude, color coding is a game changer for Gantt charts. I usually do different colors for each team or maybe priority levels - whatever works for your setup. Makes everything so much easier to read quickly. Like, you can spot problems right away instead of reading through every single task name. Your stakeholders will actually pay attention in meetings too since they can see what's happening at a glance. Oh and don't go crazy with colors - I learned that the hard way. Stick to 3-4 max or it looks like a kindergarten art project.
Think of dependencies as the connecting threads between your tasks - they show what has to finish before something else can begin. Without them? You're staring at random boxes that tell you nothing about timing. Here's the thing though - once you map these connections out, the critical path becomes super obvious. You'll spot bottlenecks way earlier too. And honestly, the best part is when one task runs late, you can instantly see which other tasks get pushed back. I'd start with whatever absolutely has to happen first, then trace forward from there.
Honestly, Gantt charts are a game changer for this stuff. They show you exactly when tasks need resources, so you can catch those annoying conflicts before they blow up your timeline. Like, you'll spot if Sarah's booked on three projects the same week or if that equipment everyone needs is double-scheduled. The visual timeline thing makes it super easy to move assignments around when priorities shift (which they always do, let's be real). I'd start by just mapping your current project on one - you'll probably be shocked at how messy your resource allocation actually is. It's like finally getting that bird's eye view you didn't know you needed.
Try swim lanes - group your tasks by team instead of just timelines. Interactive dashboards are solid too, people love clicking through project phases. There's this circular Gantt thing I've been seeing where tasks branch out from the center with dependency lines (sounds weird but actually looks pretty cool). Milestone views work well if you want to spotlight key deliverables with progress bars. For the C-suite crowd, go simple - traffic light colors tell the story fast. Really depends on your audience though. What's the context you're presenting in?
Honestly, Gantt charts are like having x-ray vision for your project's weak spots. You can see where tasks might crash into each other or where you're being way too optimistic about deadlines. The visual layout makes it super obvious which delays will mess up everything else downstream. When problems do show up - and trust me, they always do - you can drag things around and instantly see how it affects the whole timeline. I'd update yours every week or so, otherwise it becomes this useless document that doesn't match reality. Critical path stuff becomes really clear too.
Honestly, just dive into whatever project management tool you're already using - Asana, Monday, Microsoft Project all have decent tutorials to get you started. YouTube's got tons of walkthroughs too, though fair warning, some are painfully boring. Don't overthink it though. Grab a real project (even planning your next team lunch works) and build your first chart together. Tasks, dates, dependencies - that's it. My team tried learning with some fake example project and it was useless. Once you've got the basics down, you can add all the fancy stuff later. The learning curve isn't bad if you start simple.
No Reviews