


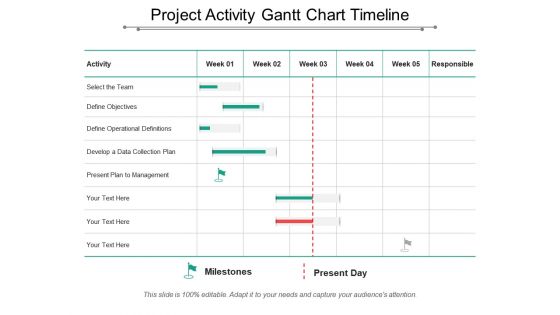
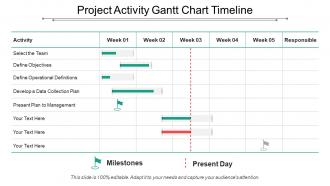
Project activity gantt chart timeline


Try Before you Buy Download Free Sample Product
 Impress Your
 Audience
Editable
of Time


Do you want to help your team members and managers understand the phases and activities involved in any project? Use our project activity gantt chart timeline PowerPoint template. This is a project management gantt chart PowerPoint graphic which showcases a timeline on weekly basis for your business activities. As gantt charts are an easy way to schedule activities and track the progress of your projects, you should include our amazing timeline PPT slide visual in your business presentations and impress your audience. To keep things simple and clear, your project managers can make use of this project activity PPT graphic and analyze the progress of their tasks and activities in a simplified manner. Gantt charts can also be prepared using a spreadsheet, but this visually appealing project activity timeline slideshow can make the slide look interesting and easy to understand for your audience. You can list out all the activities of your project including how long it will take to complete them. Also, one of the main features of our gantt chart is the ability to establish which activities are of highest priority when completing any project. So, use this creative gantt chart timeline PPT slide. Enable folks to have a jamboree with our Project Activity Gantt Chart Timeline. Institute festive events.
People who downloaded this PowerPoint presentation also viewed the following :
Project activity gantt chart timeline with all 5 slides:
Our Project Activity Gantt Chart Timeline ensure the excitement is contagious. Expectancy will grow in the audience.
FAQs for Project activity
So Gantt charts are basically horizontal bar timelines that map out your project tasks by date. What makes them different from like Kanban boards or regular to-do lists? They show you dependencies - meaning when one task gets delayed, you can see exactly how it'll mess up everything else downstream. Honestly they look kind of dated but they're clutch for complicated projects. You get that bird's eye view of whether you're behind schedule or if tasks are gonna crash into each other. Way better than trying to juggle it all in your head. Definitely try one if you've got multiple things happening at once.
Gantt charts are seriously a game changer for this stuff. When you map everything out visually, it becomes super obvious which team members are getting slammed during certain weeks. I can't tell you how many times I've caught myself double-booking people before it became a disaster. The timeline shows you exactly where resources are just sitting around doing nothing too - perfect chance to move them somewhere more useful. Honestly, the trick is keeping it updated though. Projects shift constantly, so if you're not tweaking your resource plan regularly, you'll be working off outdated info pretty quick.
So you'll want your tasks running down the left side, timeline across the top. Then just draw bars showing when each thing happens and how long it takes. Dependencies are clutch though - like when one task can't start until another finishes. That's where projects usually go sideways. Milestones help too for big deadlines. Oh and definitely add who's responsible for each task, maybe completion percentages if you're feeling fancy. Start basic with tasks and timing first. You can always add the fancy stuff later once you see what actually matters for your project.
Gantt charts are lifesavers for complex projects where tasks depend on each other. Construction, software releases, event planning - basically anything where timing matters. I learned this the hard way during a product launch that went completely sideways without proper planning (never again). They're clutch when you're coordinating multiple teams and need to show stakeholders those pretty visual timelines everyone loves. Excel templates work fine for simpler stuff, but if you've got 10+ interconnected tasks, definitely grab something like Asana. Trust me on this one.
Yeah, most Gantt tools these days connect pretty well with other project management stuff through APIs. You can sync with Jira, Trello, Asana, Monday.com - so when tasks get updated, your timeline changes automatically. Microsoft Project works great with Office (obviously), and lots of tools hook into Zapier for weird custom workflows you might need. Honestly, I'd check what integrations your current PM software already has before jumping to something new. Way easier than switching everything around. The manual data entry gets old fast if nothing talks to each other.
Honestly, the worst mistake is going crazy detailed right from the start - you'll waste hours tweaking every little subtask. I learned this the hard way on my last project. Start broad with just your main milestones and big deliverables. Always pad your timeline because Murphy's Law is real, trust me. Don't chain everything together too tightly either, or one hiccup kills your whole schedule. Oh, and treat it like a living document - things change and your chart should too. Begin simple, then drill down when you actually need the detail.
Update it weekly, maybe bi-weekly if things are moving slower. Mark off what's done and shift dates when stuff gets delayed. Dependencies are crucial - I forgot about those once and everything went sideways when one task got pushed back. Most apps let you show percentage complete, which honestly makes stakeholders happy since they can see progress at a glance. Just be consistent about it. Don't let it sit there getting outdated for weeks. I set a calendar reminder because otherwise I'd totally forget to touch it.
So dependencies are what connect your tasks together - they show which ones have to finish before others can begin. You can't just dump everything on a timeline and hope it works. Think about it like cooking - you've got to prep ingredients before you can actually start making the dish, you know? The cool thing is when you set these up right, your Gantt chart will automatically shift dates if something gets delayed. Saves you tons of manual work. I'd focus on mapping out your critical path dependencies first since those are the ones that'll really mess up your schedule if they go wrong.
Honestly, Gantt charts are lifesavers for keeping stakeholders in the loop. They show project timelines and progress visually - no more confusing spreadsheets that make everyone's eyes glaze over. When something's delayed, you just point to the chart and go "see that red section? That's our problem right there." Perfect for meetings with executives who want quick answers. They'll instantly get what's happening, what's next, and how one delay screws up everything else. Just make sure you update them regularly or people will call you out on outdated info. Also super easy to drop into presentations, which is nice.
Use different colors for each phase or team, but seriously don't go crazy with it - looks like a kindergarten art project otherwise. Critical path tasks need bold colors or thick borders so they jump out right away. Group similar stuff together and leave some breathing room between sections. Nobody wants to stare at a cramped mess that looks like Excel threw up. Oh, and keep your bar heights the same - it's weirdly distracting when they're all different sizes. Start simple first. You can always add more detail once people actually know how to read the thing.
Yeah, totally! Some agile die-hards hate the idea, but honestly Gantt charts work great for seeing sprint timelines and how user stories connect. I use them all the time for tracking progress toward releases. Just keep it simple though - don't go crazy with detailed task breakdowns like the old waterfall days. Focus on the big stuff: epics, major features, sprint boundaries. Update after retrospectives when scope inevitably changes. They're perfect for explaining things to stakeholders who need that visual timeline. Just don't treat them as some unchangeable master plan, you know?
Honestly, Gantt charts turn into a hot mess once you have complex dependencies - like, you'll end up with lines everywhere that nobody can follow. One little delay screws up your whole timeline and then you're stuck updating everything. They're way too rigid for agile stuff where things change constantly. I mean, stakeholders take one look at a cluttered chart and their eyes glaze over. Too many tasks? Forget about it. Your best bet is probably breaking big projects into smaller charts or mixing in Kanban boards. Works way better than trying to cram everything into one giant timeline that makes everyone's head hurt.
Only show what actually matters to your audience. I made this mistake early on - created these insanely detailed charts that looked like total chaos. Start with big milestones and major phases. Then get granular only for the next 2-3 weeks. Everything else? Keep it high-level for now. You can always maintain your detailed schedules separately for your own planning, but show stakeholders the clean version. Swimlanes help organize things without making people's eyes glaze over. Update weekly and hide completed stuff to keep it readable. Trust me, less is definitely more here.
Oh totally! Gantt charts work for basically everything - you just gotta tweak them for whatever you're doing. Construction folks track stuff like foundation work and framing. Software teams map out sprints and testing phases. Healthcare might do patient recruitment, trials, all that regulatory stuff. I mean, I've even seen people use them for wedding planning which is kinda hilarious but makes sense. The trick is figuring out what your main phases are and how they connect to each other. Just start by writing down the big steps your industry usually follows, then see how they flow together on a timeline.
Honestly, if your company's got the budget, Microsoft Project or Smartsheet are your best bets for enterprise stuff. But don't overthink it - Excel and Google Sheets actually have pretty decent Gantt templates now. Already using Asana or Monday.com? Just stick with those, they handle Gantt charts fine. Trello's got basic views too, though nothing fancy. For free options, GanttProject works well enough (I've used it before). My take? Start with whatever your team already knows instead of making everyone learn new software from scratch.
-
Excellent template with unique design.
-
Excellent design and quick turnaround.