


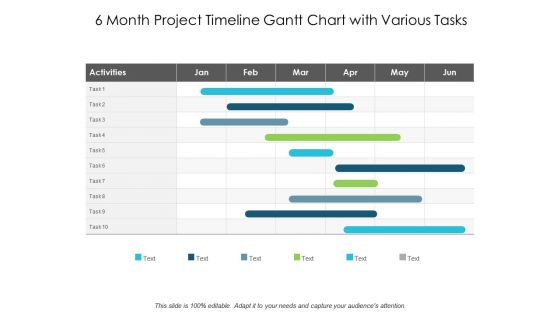
6 month project timeline gantt chart with various tasks





Try Before you Buy Download Free Sample Product
 Impress Your
 Audience
 100%
100% Editable
 Save Hours
 of Time


Ensure all explanations are crystal clear with our 6 Month Project Timeline Gantt Chart With Various Tasks. Focus on the glossary.
People who downloaded this PowerPoint presentation also viewed the following :
6 month project timeline gantt chart with various tasks with all 5 slides:
Explain the instrument with our 6 Month Project Timeline Gantt Chart With Various Tasks. Highlight the function of different constituent elements.

FAQs for 6 month project timeline gantt chart
Start with tasks and timelines - you need start/end dates for everything. Dependencies are crucial too, like which tasks can't begin until others finish. Resource assignments help you know who's doing what. Milestones are honestly the best part since they feel like mini wins when you hit them! Task duration estimates will save you headaches later. Oh, and figure out your critical path - that's the longest chain of dependent tasks that'll make or break your deadline. These basics will actually make your Gantt chart useful instead of just pretty. Build from there once everyone gets the hang of it.
Honestly, Gantt charts are game-changers for team communication. Everyone can see who's doing what and when - no more awkward "I thought you were on that" conversations. The visual timeline makes dependencies super obvious, so you catch problems early instead of scrambling later. Stakeholders eat this stuff up too since it looks professional (even when you're secretly panicking). During standups, just point to the chart - what's done, what's behind, what's next. Way easier than explaining everything verbally. Update it weekly and I swear your meetings will actually start making sense. My old PM was obsessed with these things but she wasn't wrong.
Microsoft Project and Smartsheet are the big ones you'll see everywhere. Asana's really solid too - I'd actually start there since their free version is super user-friendly. Monday.com and Trello work if you're already using them for other stuff. Excel technically does Gantt charts but ugh, updating those things is such a headache. For basic projects Asana's perfect, but if you're dealing with crazy complex timelines and dependencies? That's when you bite the bullet and pay for Microsoft Project or Smartsheet.
Gantt charts are way more flexible than most people think. Software projects? Add sprint markers and release dates. Construction? Build in permit deadlines and weather delays - trust me on that one. Color-coding everything helps tons - different colors for teams, priorities, whatever works. The timeline scale matters too. Daily view for short sprints, weekly for bigger builds. Custom fields for budget or resources are clutch. Don't forget dependencies between tasks - they'll save you headaches later. Honestly, those default templates are pretty meh anyway. I'd start with your main milestones and work backwards from there.
Think of milestones as checkpoints that break your project into bite-sized pieces. Your team gets clear targets to aim for instead of staring at one massive deadline. I honestly think they're like progress bars in games - weirdly satisfying when you hit them! Stakeholders eat this stuff up too. They love seeing those little diamonds get checked off because it shows actual progress. Place them at major deliverables, big decisions, or when you finish a whole phase. Problems get caught early, and everyone stays on the same page about what "finished" really means.
Yeah, they're perfect for that! Gantt charts let you link tasks so when something gets delayed, everything else shifts automatically. There's different types too - like "finish-to-start" where one task can't begin until another wraps up. The visual aspect is clutch though. You'll see arrows connecting everything, so it's obvious what's blocking what. Way better than trying to track dependencies in your head or some basic list. Oh and make sure you actually update the task statuses - otherwise the whole thing falls apart pretty quickly. Your team will love seeing how delays ripple through the project.
Honestly, the worst mistake is getting way too granular from the start. You'll be constantly tweaking every little task shift - it's exhausting. Don't create those nightmare dependency chains either, where everything connects to everything else. One delay and your whole timeline implodes. Build in buffer time because stuff always takes longer than expected. Keep things high-level at first, then add detail as you go. And here's the thing - your Gantt chart isn't gospel, it's just your best guess at planning. Update it regularly and actually tell your team when things change, otherwise everyone's working off different timelines.
Honestly, update it whenever something major shifts - tasks, deadlines, dependencies, whatever. Weekly reviews are usually solid for catching timeline changes. Daily updates work if you're in agile or things are moving crazy fast. The trick is staying accurate without making it your full-time job, you know? Set up auto-sync with your PM tool if you can (saves so much time), then just eyeball it weekly to make sure it still matches reality. I learned this the hard way - let it slide too long and suddenly your chart's living in fantasy land.
Honestly, color coding is a game changer for Gantt charts. You can use different colors for task priorities, team members, project phases - whatever works for your setup. Red for critical stuff, blue for one team, green for another. Makes way more sense than reading through endless text blocks. I mean, who has time for that during status meetings? Just make sure everyone on your team knows what each color means. Oh and stick with the same colors throughout - don't randomly switch things up or you'll confuse people. Trust me, once you start doing this you'll wonder how you managed projects without it.
Yeah, Gantt charts can work with Agile - just don't go crazy with them. Focus on sprints or releases instead of your whole project timeline. Keep them super lightweight and update after each sprint planning meeting. Honestly, I've seen teams get bogged down trying to chart every tiny task, which defeats the purpose. Just track your critical stuff and blockers. The reality is priorities will shift constantly (they always do), so you'll need to refresh these charts regularly. Oh, and dependencies - those are actually pretty helpful to visualize in shorter cycles.
Ugh, this happens all the time. First thing - shuffle resources to your critical path stuff or see if you can run things parallel instead of one after another. Look for tasks you can speed up or trim down without screwing up the end result. Honestly though? Sometimes delays just happen and there's nothing you can do about it. The real trick is updating your timeline constantly and giving stakeholders a heads up early - trust me, they hate surprises way more than bad news. Oh, and build buffer time into your next project so you're not always scrambling.
Okay so Gantt charts are seriously a lifesaver for juggling resources. Color-code tasks by person first - you'll instantly see who's drowning and who's twiddling their thumbs. The visual timeline makes it super obvious when someone's double-booked or when you've got three projects fighting over the same developer. I swear half my job used to be just figuring out these conflicts on paper. Now you can spot the mess early and either push deadlines around or shuffle assignments. Works great for evening out workloads too, especially if you've got that one person who somehow always ends up with everything.
Honestly, you've got to get your stakeholders involved or your Gantt chart will be totally useless. They know things you don't - like which tasks actually take forever or what dependencies you missed. Half these people are doing the actual work anyway, so they'll call out unrealistic deadlines before you embarrass yourself. I learned this the hard way on a project last year. Get their input during planning and keep checking back with them. Without buy-in from the team, you're just making pretty charts that nobody follows. Trust me, their feedback will save you from those "oh crap" moments when everything falls apart.
Look, Gantt charts are solid for timeline stuff, but don't get stuck thinking they're your only option. Kanban boards actually show workflow way better. Scrum handles changes without you wanting to throw your laptop out the window. I've watched teams spend forever tweaking their Gantt chart instead of actually building anything - kinda defeats the purpose, right? Where Gantt charts really help is showing dependencies to your boss or clients. They eat that stuff up. My take? Use Gantt for planning meetings and stakeholder updates, then switch to something more flexible for your actual daily grind.
Start big picture, then get into weeds only if they ask. Execs want critical path stuff and major milestones right up front - honestly, anything else and their eyes glaze over. Color coding is your friend (red/yellow/green). Always add a quick narrative so they actually understand what they're looking at. I'd practice the walkthrough beforehand so you don't stumble through it. Oh and definitely make a high-level version first, then keep the detailed chart ready for follow-ups. Trust me on this one - less is more with these presentations.
No Reviews