


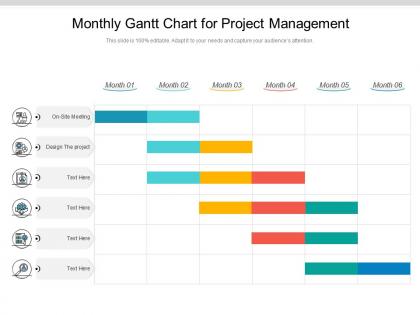
Monthly gantt chart for project management




Try Before you Buy Download Free Sample Product
 Impress Your
 Audience
 100%
100% Editable
 Save Hours
 of Time


Our Monthly Gantt Chart For Project Management are topically designed to provide an attractive backdrop to any subject. Use them to look like a presentation pro.
People who downloaded this PowerPoint presentation also viewed the following :
Monthly gantt chart for project management with all 2 slides:
Use our Monthly Gantt Chart For Project Management to effectively help you save your valuable time. They are readymade to fit into any presentation structure.
FAQs for Monthly gantt chart
So basically you need three main things - task bars, your timeline, and dependencies. Tasks go down the left side, dates across the top, then bars show how long stuff takes. But honestly? Those dependency arrows are where the magic happens - they show you what's blocking what, which is super helpful when things go sideways. Most tools also let you add milestones and track progress, though I'd skip that at first. Just do the basics - tasks, dates, simple dependencies. Once everyone can actually read the thing without getting confused, then you can make it fancier.
Honestly, Gantt charts are game-changers for avoiding those awkward "I thought you were doing that" moments. Your whole team can see who's responsible for what and when stuff's due. The best part? You'll spot dependencies right away - like if Sarah's behind, everyone knows Mike's project gets pushed back too. I'm probably obsessed with them at this point, but whatever. They help you catch problems early instead of scrambling later. Pro tip: update yours during actual team meetings. Keeps people way more engaged than just talking into the void about deadlines.
So Gantt charts are basically timelines - you plot tasks against dates and can see how everything connects and when stuff's due. Kanban boards are more about workflow, like those "to do, doing, done" columns where you move tasks around. I actually thought Gantt charts were overcomplicated at first, but they're pretty solid for bigger projects. Use Gantt when you've got strict deadlines and need that structured timeline view. Kanban's better for ongoing work where priorities shift around. Think waterfall vs agile, you know?
Honestly? Gantt charts are a lifesaver for messy projects with tons of moving pieces. Construction, software launches, product development - basically anything where Task A affects Task B affects everything else. I used to think they looked way too complicated, but that visual timeline is clutch when you're juggling multiple people or need to show your boss what's actually happening. Don't bother with them for simple stuff though. Basic to-do lists work fine there. Next time you've got overlapping deadlines and dependencies everywhere, give one a shot.
Dude, modern Gantt chart tools are game-changers compared to those static old-school ones. Everything updates in real-time, so when you drag tasks around or adjust deadlines, the whole timeline shifts automatically. Your team sees changes instantly too, which is clutch for keeping everyone on the same page. I've been using Asana lately (though Monday.com is solid too) and honestly? Going back to Excel feels like torture now. The resource dashboards, Slack integrations, email notifications - it all just works together. Maybe I'm getting lazy, but why manually update stuff when software can do it for you? Try a free trial somewhere. You'll get it immediately once you see how smooth everything flows.
Honestly, the worst thing you can do is go overboard with detail right away - you'll be constantly tweaking every little task. Dependencies are huge too. Miss those and half your team's twiddling their thumbs while waiting on stuff that should've been done weeks ago. Buffer time is non-negotiable because something always goes sideways (trust me on this one). Oh, and don't treat it like it's carved in marble. Your Gantt should change as the project moves along. Keep it simple enough that updating doesn't become a nightmare, but detailed enough to actually be useful.
So basically you assign people to tasks and track who's doing what when. The color-coding thing is clutch - I usually do different colors per person or make swim lanes. Makes it super obvious when someone's drowning in work while others are twiddling thumbs. Like you'll see Sarah with three overlapping deadlines and be like "oh shit, we need to move something." Start with just putting names on tasks first though. Don't go crazy with percentages right away or you'll hate your life. Once you're comfortable, then add the workload stuff.
So dependencies are basically tasks that have to finish before others can start - like you can't paint a wall before you build it, you know? Map out your must-haves first, then add the optional ones later. The cool thing is you'll spot your critical path and see exactly where bottlenecks might happen. When something gets delayed (and trust me, it will), everything connected automatically shifts too. It's honestly kind of nerve-wracking to watch your whole timeline cascade, but at least you'll know which tasks absolutely can't slip without screwing up your entire project.
Yeah, totally! Just don't get all rigid about it. Use Gantt charts for the big picture stuff - sprint goals, when epics depend on each other, release dates. I actually love them for keeping stakeholders happy (they eat that visual timeline stuff up). Keep it high-level though. After each sprint, update it with what really happened and tweak the future stuff. Some agile people will probably roll their eyes at this approach, but whatever - it works. The trick is treating it like a living thing that changes with your backlog and team speed, not some set-in-stone plan.
Honestly, Gantt chart software is a game changer. When tasks shift around (and they always do), everything updates automatically instead of you having to redraw the whole thing. Dependencies link together so you can see how one delay affects everything else. Your team can jump in and collaborate in real-time too. I used to waste so much time trying to make Excel look halfway decent - this stuff just works. It'll track your progress visually, bug you about deadlines, and connects with whatever other tools you're using. Start with a free version and see how much easier it is than sticky notes everywhere.
So for remote teams, you'll want something cloud-based like Asana, Monday, or Smartsheet where everyone can jump in and make updates in real-time. Set up those automated notifications too - trust me, it saves you from being the person constantly pinging people about task status. If your team's spread across time zones, throw those in the chart. Adding comment sections to each task is clutch for quick context without hopping on yet another call. Oh, and pick a regular update schedule that actually sticks, otherwise the whole thing becomes useless pretty fast.
So with Gantt charts, you're mainly watching schedule variance - basically how behind or ahead you are. Task completion percentages are huge too. Critical path stuff shows what'll actually mess up your timeline if it slips. Resource utilization is super visible, but honestly gets annoying to maintain. Milestone achievement rates matter, plus budget burn if you've got cost tracking set up. Dependencies are where things get interesting - you can actually catch bottlenecks before they wreck everything downstream. The trick is updating task progress religiously though. Skip that and your whole dashboard becomes garbage data real quick.
Honestly, Gantt charts are pretty flexible with scope changes. You can drag tasks around, add new rows, stretch timelines - most tools make it super easy. The annoying part? When one change messes up everything else downstream. I always forget how connected everything is until I move one deadline and suddenly half my project is screwed. Keep updating your critical path and double-check that you still have the right people available. Oh, and definitely track your changes somewhere - trust me, you'll want to remember why you shifted things around three weeks from now. Just treat it like a living doc and update regularly.
Dude, Gantt charts work for literally anything. Construction teams map out foundation to finishing touches with all the trade dependencies. IT people love them for sprints and testing phases. Marketing uses them to track campaign launches and content deadlines. I've honestly seen people use these things for wedding planning (which is probably overkill but whatever). The trick is figuring out what phases actually matter for your work. Just list out your typical project steps and see how they connect - boom, you've got your basic structure. Then adjust the timeframes to match your reality.
Dude, looking back at your finished Gantt charts is actually super useful. You'll see which tasks always take way longer than expected and where the real bottlenecks happened vs where you thought they'd be. Honestly, the difference between what you planned and what actually went down can be pretty brutal - but that's the good stuff! Patterns start jumping out too, like which team members consistently crush deadlines and which dependencies always mess things up. I'd definitely use this to get better at estimating time for future projects. Plus you can figure out if you're being too generous with buffer time or not generous enough.
-
Excellent products for quick understanding.