


Actual Vs Budgeted Gross And Net Profit Comparison Report




Try Before you Buy Download Free Sample Product
 Impress Your
 Audience
 100%
100% Editable
 Save Hours
 of Time


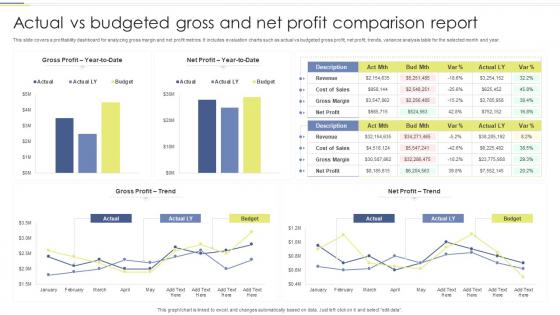
This slide covers a profitability dashboard for analyzing gross margin and net profit metrics. It includes evaluation charts such as actual vs budgeted gross profit, net profit, trends, variance analysis table for the selected month and year.
People who downloaded this PowerPoint presentation also viewed the following :
Actual Vs Budgeted Gross And Net Profit Comparison Report with all 7 slides:
Use our Actual Vs Budgeted Gross And Net Profit Comparison Report to effectively help you save your valuable time. They are readymade to fit into any presentation structure.





FAQs for Actual Vs Budgeted Gross And Net
So you'll want to focus on gross profit margin, net profit margin, and ROA - that's return on assets. Gross margin shows if you're actually making money on what you sell. Net margin is your real bottom line after everything. ROA is honestly the one most people ignore but it tells you how well your assets are working for you. Oh, and operating margin too - strips out weird one-time costs so you get a cleaner picture. I'd run these monthly and compare against industry averages. Helps you catch problems before they get ugly.
Honestly, pricing is make-or-break for your business. Go too high and you'll scare people off, but price too low and you're basically working for peanuts. I've seen so many businesses mess this up - they either race to the bottom or think they're Apple when they're not. Value-based pricing works best IMO because you're charging what people actually think it's worth. Test different price points with small groups first. Don't just look at total sales either; track profit per sale since that's what actually matters. Also check what competitors are doing and see how much customers are willing to pay.
So basically, you've got two types of costs to think about. Fixed costs don't budge no matter what - rent, salaries, that kind of stuff. Variable costs go up and down with how much you're selling or making (like materials and shipping). Honestly, once you get this straight, everything else clicks. You can figure out your break-even point and see how much each sale actually puts in your pocket. I'd just make two lists - fixed vs variable - for all your expenses. Makes the math so much easier later, trust me.
So benchmarks are basically how you figure out if your margins actually suck or not. Like, you could be celebrating 5% profit while your competitors are making 15% - yikes. Industry averages work, but direct competitor data is way better if you can find it (which is annoying since companies hide the juicy stuff). I'd start with maybe 3-5 competitors and check their numbers quarterly. Cross-industry comparisons can be useful too, depending on your business. Once you've got that context, you'll spot whether your pricing's too low or costs are out of control. Honestly beats guessing.
So there's a few ways to tackle this. I usually just start with basic trend analysis - super quick and gives you something to work with. Time series analysis digs into your historical profit patterns, then there's regression analysis which shows what actually moves the needle profit-wise. Scenario planning's clutch too - you map out best case, worst case, realistic case based on market stuff. Oh and cohort analysis if you're tracking how profitable customers are over time. Don't put all your eggs in one basket though - I'd run 2-3 methods and see where they line up.
So break-even analysis shows you exactly when you stop bleeding money and actually start making some. Super useful baseline for your profit margins. Every sale past that point? That's where the real money lives. I got a bit obsessed with tracking mine last year - you can literally see how tweaking prices or cutting costs changes everything instantly. Here's the thing though: your profit margin percentage shifts like crazy depending on how far above break-even you're running. Try calculating yours monthly. You'll start making way smarter pricing calls, trust me.
Dude, here's the thing - cash flow shows you what's actually happening with your money day to day. Your P&L might say you're profitable, but if customers are slow to pay or you've got tons of cash tied up in inventory, you could still be screwed. Bills don't care about your "paper profits," ya know? I learned this the hard way honestly. You need real cash sitting there. Smart move is tracking both your operating cash flow and net income each month. Otherwise you're flying blind on whether your business can actually survive month to month.
So basically, modern tech makes your profit analysis way less painful. AI spots those sneaky profit leaks faster than you'd ever catch them in Excel - saves me hours honestly. You get real-time dashboards that actually make sense, plus predictive stuff that shows where your numbers are headed. The whole team can jump into cloud platforms and see the same data instantly, which is clutch. Oh, and the automated reporting thing? Game changer - no more manually updating spreadsheets every week. I'd say start with whatever's eating up most of your time manually and find tech to fix that first.
Honestly, the correlation vs causation thing trips up so many people - revenue and marketing spend going up together doesn't mean one caused the other. Spreadsheet errors are way more common than anyone wants to admit (been there). Hidden costs get overlooked constantly, especially with overhead allocation being such a pain. Don't just look at short-term profits either - you might miss bigger trends happening. Oh, and analyzing profitability without thinking about what competitors are doing? Recipe for bad decisions. Always double-check your data sources and make sure your numbers actually match what's happening operationally before you act on anything.
Dude, you gotta break down your customers into groups - it's wild what you'll discover. Your overall numbers are basically lying to you. Some segments look great on revenue but they're actually bleeding you dry with all the hand-holding and discounts they need. Then you've got these tiny groups that are pure gold. I swear, every time I've seen someone do this properly, they find that like 20% of customers make 80% of the profit. Meanwhile there's usually a whole chunk that's literally losing you money. Focus your energy on the profitable ones and figure out what to do about the others - either fix them or cut them loose.
Honestly, economic stuff can totally wreck your profit numbers in sneaky ways. Rising interest rates make borrowing more expensive, which cuts into your margins. Inflation's probably the worst though - it jacks up what you pay for materials and labor way faster than you can raise prices. During recessions, demand tanks so you're stuck choosing between lower prices or selling less volume. Both suck for profits. Oh, and currency swings matter too if you're buying from overseas or selling internationally. I'd say track these external pressures alongside your regular metrics - that way you'll know if you're struggling because of the economy or because something's actually broken in your operations.
Dude, charts are a game-changer for profitability presentations. Executives literally zone out when you show them spreadsheets - it's painful to watch. Try trend lines for revenue growth and waterfall charts to show where your profits actually come from. Pie charts work great for breaking down margins by product too. The trick is keeping each chart super focused on just one key point. Don't jam everything into one visual or people get overwhelmed. Pick maybe 2-3 solid charts that tell your story and watch how much better people respond.
Honestly, it's pretty simple - either make more money or spend less. I'd start by looking at your biggest expenses since that'll move the needle fastest. Maybe you can automate some of the boring repetitive stuff or negotiate better deals with suppliers. On the revenue side, think about raising prices (most people are way too scared to do this) or pushing your higher-margin products harder. Oh, and definitely track your margins by product - you'd be shocked how much money some businesses lose on certain items without even realizing it. Most companies are way fatter than they think.
Look, your team's performance literally shows up in your profits. Good performers who actually care? You'll see 20-25% better margins compared to companies with checked-out employees. It works backwards too - when you're making money, you can spend more on developing people. Creates this whole cycle that's actually pretty cool to see happen. But here's the thing - bad performers don't just suck individually. They tank everyone else's mood and piss off customers. I'd track your performance stuff against revenue per employee every quarter so you can catch problems before they get ugly.
Look, risk management is basically your safety net for profits. You catch problems early so they don't steamroll your cash flow later. I learned this the hard way honestly - one bad quarter can undo months of solid work if you're not paying attention. It's like checking your blind spots before changing lanes. You want to chase those profitable opportunities, but smart businesses bake risk assessment right into their regular profit reviews. That way you spot the ugly stuff before it crushes your margins. Simple concept, but it'll save your butt.
-
Huge collection of high-quality templates. Worth each penny.
-
Wonderful templates design to use in business meetings.