

Financial Performance Highlights With Net Profit Margin




Try Before you Buy Download Free Sample Product
 Impress Your
 Audience
 100%
100% Editable
 Save Hours
 of Time


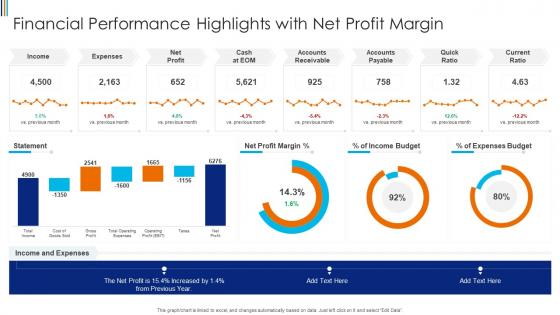
Our Financial Performance Highlights With Net Profit Margin are topically designed to provide an attractive backdrop to any subject. Use them to look like a presentation pro.
People who downloaded this PowerPoint presentation also viewed the following :
Financial Performance Highlights With Net Profit Margin with all 7 slides:
Use our Financial Performance Highlights With Net Profit Margin to effectively help you save your valuable time. They are readymade to fit into any presentation structure.





FAQs for Financial Performance Highlights With
The formula for calculating net profit margin is (Net Income ÷ Total Revenue) × 100, expressed as a percentage. This metric enables businesses to assess operational efficiency and profitability compared to competitors, with many organizations using it to track performance trends, make strategic pricing decisions, and demonstrate financial health to investors, ultimately delivering valuable insights for sustainable growth.
Net profit margin measures profitability after all expenses including taxes, interest, and operating costs, while gross profit margin only accounts for direct production costs. Gross margin helps retailers and manufacturers assess production efficiency, whereas net margin provides investors and stakeholders with comprehensive insight into overall financial health, operational effectiveness, and long-term sustainability across diverse business sectors.
Net profit margin is crucial because it reveals a company's overall financial health, operational efficiency, and ability to convert revenue into actual profit after all expenses. This metric enables investors, lenders, and management to assess profitability compared to competitors, make strategic decisions about resource allocation, and identify areas for cost optimization, ultimately delivering sustainable growth and competitive advantage in increasingly demanding markets.
**INPUT**: What factors can impact a company's net profit margin? **OUTPUT**: Several factors can impact a company's net profit margin, including revenue fluctuations, operational costs, tax rates, interest expenses, and pricing strategies. These elements work together across industries, with manufacturing companies managing production costs while service businesses focus on labor efficiency, ultimately determining how much profit remains after all expenses are deducted from total revenue.
Businesses can improve their net profit margin by reducing operational costs, optimizing pricing strategies, enhancing operational efficiency, streamlining supply chains, and minimizing tax burdens. Through strategic automation and process improvements, companies across retail, manufacturing, and financial services enhance revenue while controlling expenses, ultimately delivering sustainable profitability and competitive advantage in increasingly demanding markets.
Companies should consider industry-specific benchmarks, as net profit margins vary significantly across sectors, with technology firms often achieving 15-25%, retail businesses typically seeing 2-5%, and manufacturing companies averaging 5-10%. These benchmarks enable organizations to assess competitive positioning, identify operational efficiency opportunities, and set realistic financial targets, with many companies finding that consistent margin improvement above industry averages delivers sustainable competitive advantage.
Net profit margin directly measures overall business profitability by showing what percentage of revenue remains after all expenses, taxes, and costs are deducted. This metric enables companies to assess operational efficiency, compare performance against competitors, and make strategic decisions about pricing, cost management, and resource allocation, with many organizations finding that consistent margin improvement ultimately drives sustainable growth and competitive advantage.
Pricing strategy directly determines net profit margin by establishing revenue levels relative to costs, influencing customer demand patterns, and positioning products competitively within market segments. Strategic pricing approaches, including value-based pricing, dynamic pricing models, and premium positioning, enable businesses to optimize margins while maintaining market share, with many companies finding that balanced pricing strategies deliver sustainable profitability and competitive advantage.
Net profit margin varies dramatically across sectors due to fundamental differences in operational costs, competitive dynamics, capital requirements, and market structures. Industries like software and financial services typically achieve higher margins through scalable operations, while manufacturing, retail, and hospitality sectors face lower margins due to substantial operational expenses, ultimately reflecting each sector's unique business model and competitive landscape.
A negative net profit margin threatens business sustainability by depleting cash reserves, limiting reinvestment capacity, and reducing access to funding sources. This financial position creates cascading effects including reduced operational flexibility, difficulty attracting investors, and challenges meeting debt obligations, ultimately forcing businesses to restructure operations or consider closure unless profitability improves.
Common pitfalls include ignoring seasonal variations, failing to account for one-time expenses, comparing margins across different industries without context, and focusing solely on percentages rather than absolute dollar amounts. Many businesses also overlook hidden costs like depreciation or inventory adjustments, ultimately missing opportunities to identify genuine operational inefficiencies and strategic improvement areas.
Taxes directly reduce net profit margin by decreasing the bottom-line earnings used in the calculation, as they represent mandatory expenses deducted from pre-tax income. Companies increasingly employ strategic tax planning, including deductions, credits, and optimization strategies, to minimize their tax burden and preserve margins, with many organizations finding that effective tax management significantly enhances overall profitability and competitive positioning.
Effective ways to communicate net profit margin in presentations include visual charts, trend comparisons, industry benchmarks, ratio breakdowns, and scenario modeling. These approaches enhance stakeholder understanding by presenting financial data through clear graphics, contextual analysis, and strategic narratives, ultimately enabling better decision-making and demonstrating competitive positioning across various business scenarios.
Changes in operating expenses directly impact net profit margin through cost management, operational efficiency, and resource allocation strategies. When companies streamline operations, automate processes, or optimize workforce deployment, they enhance profitability ratios significantly, with many organizations finding that strategic expense reduction ultimately delivers competitive advantages and improved shareholder returns in increasingly cost-conscious markets.
Businesses can track net profit margin using financial analytics platforms like QuickBooks, SAP, and Tableau, alongside specialized tools such as Microsoft Power BI, Oracle Financial Analytics, and industry-specific dashboards. These solutions streamline data collection, automate reporting calculations, and deliver real-time insights through customizable visualizations, with many organizations finding that integrated analytics ultimately enhance decision-making speed and strategic profitability planning.
-
The presentations are very helpful. I am always able to get appropriate templates for the different topics related to my profession.
-
They saved me a lot of time because they had exactly what I was looking for. Couldn’t be happier!