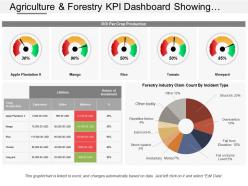
Agriculture and forestry kpi dashboard showing roi per crop production and industry claim count
Try Before you Buy Download Free Sample Product
Audience
Editable
of Time
Check out our agriculture and forestry KPI dashboard showing ROI per crop production and industry claim count PPT template. There are a variety of different kinds of business dashboards that you can use to display the information compiled in your reports. Pie charts and tables are used for making comparisons and showing proportions. These are very effective when you visually compare a few categories. Our PowerPoint graphic slide makes it extremely easy to convert your business information into editable charts. You can display and analyze the production of your crops and compare all the varieties of crops that you deal into using these charts and table designs. Also, ample space has been provided beside the charts so that you can enter important points related to the chart and its categories. This agriculture and forestry KPI dashboard PPT Presentation diagram assists you to display your agricultural information in the best possible manner. Our Agriculture And Forestry Kpi Dashboard Showing Roi Per Crop Production And Industry Claim Count are a beast of burden. They can carry the heaviest of loads.
People who downloaded this PowerPoint presentation also viewed the following :
Agriculture and forestry kpi dashboard showing roi per crop production and industry claim count with all 6 slides:
Control the activity at it's height with our Agriculture And Forestry Kpi Dashboard Showing Roi Per Crop Production And Industry Claim Count. Ensure everything goes flawlessly.
FAQs for Agriculture and forestry kpi dashboard showing roi per crop production and
Key crop yield KPIs include yield per acre, harvest quality ratings, crop loss percentages, seasonal growth rates, and input-to-output ratios. These metrics enable agricultural operations to optimize planting strategies, resource allocation, and harvest timing, with many farming enterprises finding that systematic yield tracking delivers improved profitability and sustainable production practices.
An agriculture KPI dashboard enhances farmer decision-making by providing real-time visibility into crop performance, resource utilization, weather patterns, and financial metrics through centralized data visualization. By consolidating information from soil sensors, irrigation systems, and market data, farmers can optimize planting schedules, reduce input costs, and maximize yields, ultimately delivering improved profitability and sustainable farming practices.
Data visualization transforms complex agricultural data into clear, actionable insights by presenting crop yields, soil conditions, weather patterns, and resource usage through intuitive charts, graphs, and heat maps. Through visual dashboards, farm managers and agribusiness operators can quickly identify trends, spot potential issues like pest outbreaks or irrigation inefficiencies, and make informed decisions that optimize productivity, reduce costs, and ultimately enhance operational efficiency across their agricultural operations.
Farmers should update their KPI dashboards weekly for operational metrics like soil moisture and crop health, with monthly updates for financial performance and seasonal trend analysis. Through real-time data integration and regular review cycles, agricultural operations can respond quickly to weather changes, market fluctuations, and crop development stages, ultimately delivering improved yields and enhanced operational efficiency.
Livestock management dashboards should include feed conversion ratios, mortality rates, weight gain tracking, reproductive performance metrics, and health incident frequencies. These metrics enable farms and agricultural operations to optimize resource allocation, reduce operational costs, and enhance productivity, with many livestock facilities finding that comprehensive monitoring ultimately delivers improved animal welfare and increased profitability.
IoT sensors and smart agriculture technologies enhance KPI data collection by providing real-time soil moisture monitoring, automated weather tracking, crop growth analytics, and livestock health measurements. These systems streamline farm operations by delivering precise irrigation scheduling, predictive yield forecasting, and resource optimization insights, with many agricultural enterprises finding that connected sensor networks ultimately reduce operational costs while significantly improving crop productivity and sustainable farming practices.
Best practices for designing user-friendly agriculture KPI dashboards include intuitive layout design, real-time data integration, customizable metrics display, mobile responsiveness, and visual clarity through charts and graphs. These dashboards streamline farm operations by enabling quick decision-making, tracking seasonal performance patterns, and monitoring resource efficiency, with many agricultural enterprises finding that well-designed interfaces ultimately deliver improved productivity and enhanced operational oversight.
An agriculture KPI dashboard facilitates better resource allocation by providing real-time visibility into crop performance, soil conditions, water usage, equipment efficiency, and financial metrics across different fields and seasons. Through data-driven insights, farmers can optimize fertilizer application, irrigation scheduling, and labor deployment, while identifying underperforming areas, ultimately reducing costs and maximizing yield potential in an increasingly competitive agricultural landscape.
Weather data integration involves incorporating real-time meteorological information, historical climate patterns, soil moisture sensors, satellite imagery, and predictive weather models directly into dashboard analytics. This strategic combination enables farmers to anticipate crop yields, optimize irrigation schedules, and adjust planting timelines, while agribusinesses can better manage supply chains and resource allocation, ultimately delivering more accurate forecasting and enhanced operational efficiency.
Financial KPIs influence agricultural sustainability by tracking profitability per acre, input cost efficiency, and return on sustainable investments like precision farming technologies. These metrics enable farmers to balance economic viability with environmental stewardship, with many agricultural operations finding that sustainable practices, while requiring initial investment, ultimately deliver lower input costs, improved soil health, and enhanced long-term profitability.
Challenges in collecting accurate agriculture KPI data include inconsistent field measurements, equipment calibration issues, weather interference, fragmented data sources, and manual recording errors. These obstacles can be overcome by implementing IoT sensors for real-time monitoring, standardizing measurement protocols across farms, integrating cloud-based data platforms, and training staff on digital collection methods, ultimately delivering more reliable insights and improved operational decision-making.
KPIs linked to soil health can be effectively communicated through dashboards using visual indicators like heat maps for pH levels, nutrient density charts, erosion risk meters, and moisture content graphs. These visualizations enable farm managers to quickly identify problem areas, track improvement trends over time, and make data-driven decisions about fertilization and crop rotation, ultimately enhancing agricultural productivity and sustainability.
Market trends significantly influence agricultural KPIs by shifting focus toward consumer demand patterns, sustainability metrics, price volatility indicators, and supply chain efficiency measures. Farmers increasingly prioritize organic certification rates, water usage optimization, and direct-to-consumer sales tracking when market trends favor sustainable practices, while commodity price fluctuations drive emphasis on cost-per-acre analysis and yield forecasting, ultimately enabling strategic adaptation and competitive positioning.
Farmers can use agriculture KPI dashboards to compare their yield per acre, input costs, resource efficiency, and profitability metrics against regional and industry benchmarks through integrated data analytics. These dashboards enable producers to identify performance gaps, optimize resource allocation, and implement best practices from top-performing operations, ultimately delivering improved competitiveness and sustainable farming outcomes.
Stakeholder feedback ensures KPIs remain relevant, actionable, and aligned with evolving agricultural priorities, operational needs, and strategic objectives. Through regular input from farmers, agronomists, and farm managers, organizations can refine metrics like yield efficiency, resource utilization, and sustainability indicators, ultimately delivering more targeted insights and enhanced decision-making capabilities.
-
Really like the color and design of the presentation.
-
Designs have enough space to add content.