


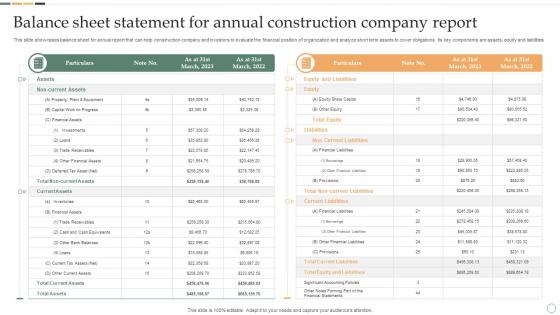
Balance Sheet Statement For Annual Construction Company Report




Try Before you Buy Download Free Sample Product
 Impress Your
 Audience
 100%
100% Editable
 Save Hours
 of Time


This slide showcases balance sheet for annual report that can help construction company and investors to evaluate the financial position of organization and analyze short term assets to cover obligations. Its key components are assets, equity and liabilities
People who downloaded this PowerPoint presentation also viewed the following :
Balance Sheet Statement For Annual Construction Company Report with all 6 slides:
Use our Balance Sheet Statement For Annual Construction Company Report to effectively help you save your valuable time. They are readymade to fit into any presentation structure.





FAQs for Balance Sheet Statement For Annual
So a balance sheet breaks down into three parts: assets, liabilities, and equity. Assets are what the company owns - cash, inventory, equipment, all that stuff. Liabilities? That's what you owe people, like loans and unpaid bills. Equity is the owner's piece after you subtract what's owed from what's owned. The whole thing has to balance out (pretty clever name, right?). Assets always equal liabilities plus equity - honestly, if the math doesn't work, something's definitely wrong. Worth double-checking that first when you're looking at one!
So basically, your balance sheet is like a snapshot - shows what you own vs what you owe right now. Your income statement? That's tracking revenue and expenses over time, like quarterly, to see if you're actually making money. Cash flow is where it gets tricky though - it shows how cash moved around, which isn't the same as profit (learned that the hard way lol). You might look profitable on paper but still can't pay bills. Honestly, you need all three to really know what's going on with your business finances.
So the accounting equation is basically the backbone of all financial stuff - assets = liabilities + equity. Think of it like your company's assets (everything you own) has to equal what you owe others plus what the owners actually have in it. It's honestly pretty simple but super important. Your balance sheet won't work without it being perfectly balanced. I always tell people to double-check this when they're looking at financial statements because if the math doesn't add up, something's definitely wrong somewhere. It's like a quick sanity check, you know?
Think of a balance sheet like a financial snapshot - shows what they own vs what they owe right now. First thing I check? Whether their debt totally outweighs their assets (major red flag). Also look at if they've got enough cash to actually pay their short-term bills. The debt-to-equity ratio matters a ton since it shows how much they're borrowing relative to what they own. Working capital's another big one - just current assets minus current liabilities. Honestly, comparing these numbers to industry averages is where you'll really see if they're doing well or struggling.
So current assets are basically stuff you can turn into cash within a year - your actual cash, what customers owe you, inventory, short-term investments. They're super important for figuring out if you can pay your bills without panicking. All those liquidity ratios? Current ratio, quick ratio - they all use current assets. I've watched way too many businesses look profitable on paper but then struggle because their cash flow was a mess. Watch your mix though. If most of your current assets are tied up in inventory that won't move, you're kinda screwed.
So long-term liabilities are basically debts your company doesn't have to pay back for over a year - mortgages, bonds, that kind of stuff. They live on the balance sheet and show investors how much debt you're carrying. Credit analysts love looking at these too, obviously. What's cool is they help people figure out your debt-to-equity ratios and see how you're funding growth. Honestly, I always compare the long-term debt to total assets when I'm checking if a company's in decent shape. You'll want to make sure they can actually handle what they owe down the road.
So equity is just what shareholders actually own after subtracting all debts from assets. Company has $100k in assets, owes $30k? Shareholders get $70k - that's their piece of the pie. It's like house value minus mortgage, but messier with retained earnings and other accounting stuff. Higher equity compared to total assets means shareholders are in better shape. Honestly, I always look at whether equity's growing year over year when checking out investments. That's where you'll see if real value is being created or if management's just spinning their wheels.
Ugh, the assets = liabilities + equity thing gets SO many people - definitely double-check that. Current vs non-current classification is another big one. I always forget about accrued expenses and prepaid stuff at first, honestly. Recording things in the wrong period (especially around month-end) will totally screw you over. And depreciation calculations... don't even get me started on how those can snowball into a mess. You'll save yourself tons of headaches if you just make a quick checklist of this stuff and run through it each time before you call it done.
So basically, grab their last few balance sheets and check three main things. Current ratio first - that's current assets divided by current liabilities. Shows if they can actually pay their bills. Then look at debt-to-equity to see how much they owe vs own. Some debt's fine, but you don't want them drowning in it. Compare these numbers over 2-3 years to catch any sketchy trends. Honestly the whole thing's just like checking someone's bank account before lending them money - you want the full picture, not just what they tell you.
So basically when a company's debt-to-equity ratio is really high, they're borrowing tons of money compared to what they actually own. Makes sense why lenders get sketched out, right? More debt means riskier investment and those interest payments start killing their profits. Don't get me wrong - some debt can help companies grow faster. But once you hit like 2:1 or higher, that's usually trouble. Oh and definitely check what's normal for that specific industry first, because tech companies vs manufacturing have totally different standards. Some sectors just need way more upfront cash than others.
Seasonal businesses will throw off your balance sheet analysis big time if you're not paying attention to timing. A ski resort in July looks completely different than in December, right? Working capital and inventory swing like crazy depending on when you grab the data. You really need quarterly snapshots throughout the year - year-end numbers alone won't cut it. Current ratio and inventory turnover start making way more sense when you track them across seasons. Compare same periods year-over-year too, otherwise you're just chasing seasonal fluctuations instead of real trends. Trust me on this one.
So basically, public companies have to deal with way more paperwork because of SEC rules. They're stuck following super strict GAAP standards with tons of footnotes explaining every little thing. Private companies? Way more chill - you can format however you want and skip a lot of the detailed stuff. Though honestly, some private balance sheets I've seen are almost embarrassingly simple lol. But here's the thing - if you're thinking about going public, just know your accounting team is gonna hate you. The workload literally triples with all that extra documentation bullshit.
So there's a couple ways to handle this. You can restate your historical costs using inflation indices - basically converting everything to current purchasing power. Or update asset values to fair market value instead of book value. Like that office building you bought years ago that's probably worth way more now? Yeah, stuff like that. Some companies actually do both - they'll keep their regular GAAP statements but also create supplementary inflation-adjusted ones. Whatever method you pick, just stay consistent with it and document what you're doing. I'd start with the assets that inflation hit hardest and work through those first.
Look, for balance sheet stuff I'd just start with Excel or Google Sheets - super straightforward and everyone gets it. Your company might have Tableau or Power BI which honestly makes everything look way fancier than it needs to be, but clients eat that up. QuickBooks has decent built-in reports too if you're already using it. Sometimes the simplest bar chart showing assets vs liabilities over a few quarters hits harder than all the bells and whistles anyway. Oh and don't overthink it - clear beats flashy every time. Use whatever you've got access to first.
Monthly is your sweet spot - most accountants won't let you get away with less than quarterly anyway. I've watched too many businesses wait until December and then panic when nothing adds up. Catching mistakes early saves you so much headache later. Real-time financial visibility is huge, especially if you're growing fast or processing tons of transactions. Honestly, some companies do it weekly but that might be overkill starting out. Try monthly first and see how it goes - you can always dial it up or down depending on what your business actually needs.
-
Professional and unique presentations.
-
This design is not only aesthetically pleasing but it has many uses making the cost worthwhile. The graphics look stunning, and you can edit them as per your needs.