


Balanced scorecard model powerpoint presentation slides





Try Before you Buy Download Free Sample Product
 Impress Your
 Audience
 100%
100% Editable
 Save Hours
 of Time


Creating a professional PPT on the balanced scorecard is not an easy task. It requires a lot of time with professional designing and research skills. To help you out, we have come up with content ready balanced scorecard model PowerPoint presentation slides which you can use to measure the progress of the business activities performed by the staff. Our PowerPoint designers have designed this performance management report PPT presentation whereas our research experts have researched the relevant content. This editable balanced scorecard framework presentation covers five different creative slide layout using which you can represent the team members performance report in an ideal way. Impress your viewers using these presentation slides as our designers have used a fantastic creative of tables and icons of the dollar, customer, gears, team members, bar graph, group, vision, target board, priorities, notepad with a pen, training, and more. As the presentation slides are editable, you can insert and remove the slides or the content inside the templates as per the needs. Our Balanced Scorecard Model Powerpoint Presentation Slides are the aces in your hand. Acquire all the available advantage.
People who downloaded this PowerPoint presentation also viewed the following :
Content of this Powerpoint Presentation
Slide 1: This slide introduces Balanced Scorecard Model. State Your Company Name and get started.
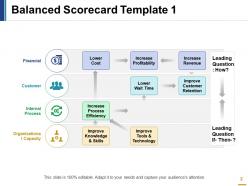
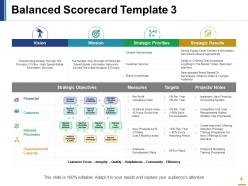
Slide 2: This slide showcases Balanced Scorecard Template 1 with these of the following parameters- Lower Cost, Increase Profitability, Increase Revenue, Improve Customer Retention, Increase Process Efficiency, Improve Knowledge & Skills, Improve Tools & Technology, Lower Wait Time, Internal Process, Organizational Capacity, Financial, Customer.
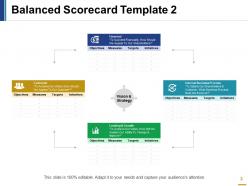
Slide 3: This slide presents Balanced Scorecard Template 2. You can use with these Vision & Strategy.
Slide 4: This slide showcases Balanced Scorecard Template 3 with these of the following factors- Increase Revenue, Increase Profitability, Decrease Operating Costs, Improve Clarity Offering, Improve Market Perception, Improve Customer Satisfaction, Improve Offering Selection, Improve Information Services, Improve Stock Reliability, Improve Cost Control, Improve Knowledge & Skills, Improve Technology, Improve Supply Chain.
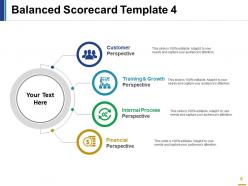
Slide 5: This slide presents Balanced Scorecard Template 4 with these of the following parameters- Customer Perspective, Training & Growth, Internal Process, Financial.
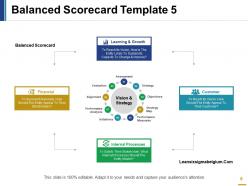
Slide 6: This slide showcases Balanced Scorecard Template 5 which further showcases Vision & Strategy Balanced Scorecard Strategy, Strategy Map, Performance Analysis, Alignment, Evaluation, Objectives, Performance Measures, Initiatives, Assessment.
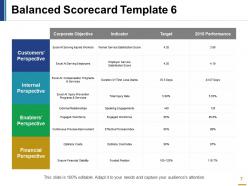
Slide 7: This slide presesnts Balanced Scorecard Template 6.
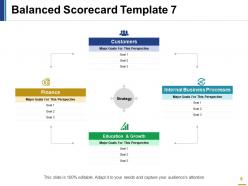
Slide 8: This slide showcases Balanced Scorecard Template 7 which further showcases strategy and its four various stages.
Slide 9: This slide presents Balanced Scorecard Model Icons Slide.
Slide 10: This slide is titled Additional slides.
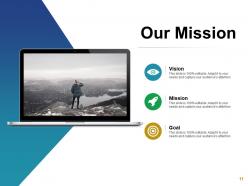
Slide 11: This slide contains Our Mission with text boxes.
Slide 12: This slide helps depict Our Team with text boxes.
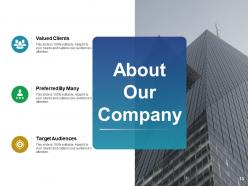
Slide 13: This slide helps show- About Our Company. The sub headings include- Creative Design, Customer Care, Expand Company .
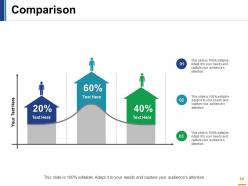
Slide 14: This slide shows Comparison of number of users and Time.
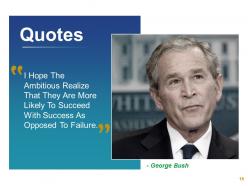
Slide 15: This is a Quotes slide to highlight, or state anything specific.
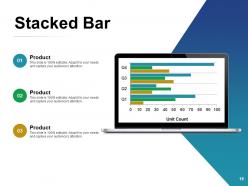
Slide 16: This slide shows a Stacked Line graph in terms of percentage and years for comparison of Product 01, Product 02, Product 03 etc.
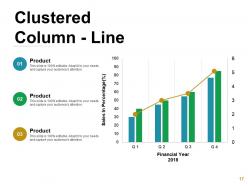
Slide 17: This slide presents Clustered Column - Line.
Slide 18: This is a Thank You slide with Address:# street number, city, state, Contact Numbers and Email Address.
Balanced scorecard model powerpoint presentation slides with all 18 slides:
Expose the flaws in an intolerant approach with our Balanced Scorecard Model Powerpoint Presentation Slides. Be able to challenge the bigots.



FAQs for Balanced scorecard model
So the Balanced Scorecard breaks down into four areas: Financial stuff (revenue, profits, costs), Customer metrics (how happy they are, retention rates), Internal Processes (how efficiently you're running things), and Learning & Growth (employee development, systems). It's basically like having a complete dashboard instead of just staring at spreadsheets all day. Here's the thing - these all connect to each other, which is pretty smart actually. Pick maybe 3-4 key metrics for each area that actually matter to your strategy. Then figure out how they influence each other. Way better than just obsessing over quarterly numbers.
Honestly, just start with your four main areas - money stuff, customers, internal processes, and employee development. Map out how they actually connect to each other. Better training should improve your processes, right? Which makes customers happier, which obviously boosts your bottom line. Don't pick metrics just because they're simple to measure - that's such a waste. You need KPIs that genuinely reflect what matters. The cool part is watching how one win triggers the next. I'd say test those connections every few months though, since things change faster than you think.
Honestly, measurement makes or breaks your whole Scorecard. Pick 3-5 solid metrics for each perspective that actually connect to what you're trying to achieve strategically. Don't just grab whatever data's easiest to find - that's a rookie mistake I see all the time. You need metrics across financial, customer, internal processes, and learning perspectives that show real progress. Otherwise you're just guessing if your strategy works. Make sure you can reliably collect the data too, because there's nothing worse than building a scorecard around metrics you can't actually track consistently.
So the Balanced Scorecard basically gets everyone on the same page by connecting all the dots - financial stuff, customer happiness, internal processes, learning goals. You know how departments usually work in silos? This fixes that mess. Marketing's retention numbers suddenly tie directly to finance's revenue targets. Teams start talking to each other because they can actually see how their work impacts everyone else's metrics. Your meetings get so much better when you're all staring at the same dashboard instead of random spreadsheets. Honestly, just find where your department metrics overlap first - that's your goldmine right there.
Honestly, the hardest part is convincing leadership it's worth doing - they love their financial numbers too much. Data quality will drive you crazy, and getting departments to actually agree on anything? Good luck with that. Most people just pick whatever's easiest to track instead of what actually matters. Oh, and everyone says they want "balanced" but then obsess over revenue anyway. Start with just one team first - way less headache. Get your baseline data locked down before you do anything else. Make sure people can actually see how their day-to-day connects to the scorecard, otherwise they'll ignore it completely.
Honestly, just make it fit your actual business instead of using some cookie-cutter template. Tech companies obsess over customer acquisition costs and churn rates. Manufacturing? They care more about efficiency and not having people get hurt on the job. Map out what actually drives your success first, then create metrics around that. Weight the different perspectives based on what matters most right now - like, if you're bleeding customers, maybe focus less on internal processes for a bit. The whole point is telling your business story through numbers that actually mean something.
So financial metrics are your basic stuff - revenue, profit margins, ROI, cost cuts. Pretty straightforward, but they only show what already went down money-wise. Non-financial metrics are way more interesting though. Customer satisfaction, employee engagement, how smooth your processes run, innovation rates. These actually predict where your finances are heading instead of just telling you old news. I always think of it like this - financial metrics are your rearview mirror, non-financial ones are your headlights lighting the road ahead. Track both and you'll see today's happy customers become tomorrow's revenue bump.
So the Balanced Scorecard is basically this feedback loop that keeps you honest about your strategy. You track stuff like training hours (leading indicators) next to revenue numbers (lagging ones), which is pretty smart because you catch problems early. What I love about it is how it shows the connections - like if customer satisfaction tanks but you've been pumping money into training, maybe that training isn't actually helping. You're always tweaking these relationships based on what's really happening. My advice? Review it quarterly and focus on what caught you off guard - that's where you learn the most.
Honestly, tech makes Balanced Scorecards way less painful. Instead of those awful monthly spreadsheet marathons, you'll get real-time dashboards that actually update themselves. Set up automated KPI tracking from your current systems. Interactive charts help stakeholders understand what's happening without you explaining everything. Alerts ping you when numbers go off track. Cloud platforms mean everyone accesses the same version - no more "which file is the latest?" headaches. Pick something that plays nice with your existing tools though. I'd start with whatever manual process is driving you crazy first and automate that.
So here's what works: ask each stakeholder group what success actually looks like to them first. Then build those into your scorecard across the four areas. Customer satisfaction and retention rates are obvious ones. Employee engagement matters too - people forget that unhappy workers tank everything else. Financial stuff like ROI keeps shareholders happy. But honestly, the community angle gets ignored way too much. Environmental impact, local hiring, that kind of thing. The trick isn't just tracking money outcomes - you want those early warning metrics that show you're heading in the right direction before problems hit.
Performance indicators are basically the metrics that show if you're actually hitting your strategic goals across those four Balanced Scorecard areas. Without real measurements, your strategy is just fancy wishful thinking. These numbers work like vital signs for your business - they reveal what's really happening vs. what you hoped for. The trick is choosing indicators that drive the right behavior, not just vanity metrics that stroke your ego. They keep people accountable too. Honestly, I've seen too many companies pick easy-to-track stuff that doesn't matter. You'll want ones that help catch problems early.
Yeah, you can totally layer BSC with other frameworks! Most companies I've seen do it with OKRs - just use the BSC perspectives as buckets for your objectives. Works pretty well. Lean/Six Sigma pairs nicely too, especially for tracking process improvements in the internal perspective. Some orgs go all out and throw in strategy mapping or risk frameworks. Just don't make the same mistake we did - having conflicting metrics across systems is a nightmare. Map your current goals against those four BSC perspectives first, then spot the overlapping KPIs so you're not drowning people in measurements. Trust me on that one.
Get your leadership team on the same page first - seriously, this part will make or break everything. Don't let executives build this thing alone in some boardroom. Pull in people from different departments who actually do the work. Keep it to 15-20 metrics tops. I've watched companies create these monster scorecards with 50+ KPIs that nobody ever looks at. Your four perspectives need to connect logically, and honestly? Pick stuff your team can actually control, not just random numbers to track. Oh, and figure out how you'll review it regularly or it'll just collect dust.
Honestly, just watch if people actually use the thing in meetings and planning stuff. Are your key metrics moving in the right direction? Do employees get how their day-to-day work connects to bigger company goals? The real test is whether it becomes part of your regular routine instead of collecting dust somewhere. I'd also check if departments are collaborating better now that they can see how they affect each other's numbers. Survey your team quarterly about whether it's actually helpful for their work - that'll tell you everything. Oh, and managers should be referencing it naturally, not because they have to.
From what I've seen, healthcare, manufacturing, and financial services get the most out of Balanced Scorecards. Hospitals dig it because they can track patient outcomes AND operational stuff - which honestly just makes sense with how crazy complex healthcare is. Manufacturing uses it to balance cutting costs while keeping quality up. Banks love how it aligns their risk management with growth goals. Oh, and insurance companies too. These industries all juggle multiple stakeholders who want different things, so that four-perspective setup really works. You should check out some case studies if you're in any of these areas.
No Reviews