

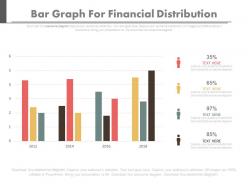
Bar graph for financial distribution with year based analysis powerpoint slides





Try Before you Buy Download Free Sample Product
 Impress Your
Audience
 100%
Editable
 Save Hours
of Time


Narrate your story with our extremely informative and exquisite Bar chart for Financial distribution with year based analysis PPT presentation templates. As it is evident that in an organisation the concept of fiscal management and distribution holds a lot of importance and its effective representation and implementation forms the basis of a successful business. Also, the main purpose of these pre-designed layouts is to save your valuable time along with proposing accurate and precise information to the audience. Apart from this, in order to hold the interest of the viewers to the presentation instead of making them feel like they are held captive simply combine these interesting illustrations with your presentations. Moreover, the graphic of bar graphs and the icons in these diagrams are of exceptional quality and extremely unique. Overall, to impose an everlasting impact on the viewers and to create a strong connection with the members of the audience, simply click Download. Our Bar Graph For Financial Distribution With Year Based Analysis Powerpoint Slides are glad to do your bidding. They enjoy being of assistance.
People who downloaded this PowerPoint presentation also viewed the following :
Bar graph for financial distribution with year based analysis powerpoint slides with all 5 slides:
Broadcast your brilliance effectively with our Bar Graph For Financial Distribution With Year Based Analysis Powerpoint Slides. They help build consumer confidence.


-
Awesome use of colors and designs in product templates.
-
Content of slide is easy to understand and edit.