

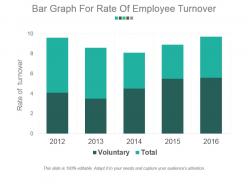
Bar graph for rate of employee turnover example of ppt presentation





Try Before you Buy Download Free Sample Product
 Impress Your
Audience
 100%
Editable
 Save Hours
of Time


Explain the aerodynamics with our Bar Graph For Rate Of Employee Turnover Example Of Ppt Presentation. Elaborate on the forces acting on big jets.
People who downloaded this PowerPoint presentation also viewed the following :
Bar graph for rate of employee turnover example of ppt presentation with all 5 slides:
Our Bar Graph For Rate Of Employee Turnover Example Of Ppt Presentation help develop the driving force. The impact can be enormous.


FAQs for Bar graph for rate of employee turnover example
Bad managers are hands down the biggest reason people bail - that saying about leaving bosses not companies is spot on. Poor pay and zero career growth come next. Toxic culture kills morale too. Work-life balance matters way more than most companies think it does. People also get fed up with no recognition or training opportunities, plus when nobody explains what they're actually supposed to be doing. Oh, and unclear expectations drive everyone crazy. If turnover's bad at your place, definitely survey people on their way out and maybe do some "stay interviews" with current folks to figure out what's actually broken.
Honestly, your turnover data is like a detective story waiting to be solved. Look for spikes in specific departments or time periods - that's where the real drama happened. Maybe it was Bob from accounting being a nightmare manager, or that clunky new system everyone hated. Exit interviews are gold here, but people don't always tell the truth when leaving. I'd start with your worst departments first and really dig into compensation vs workload issues. Short bursts of departures usually mean something specific went wrong. The patterns show you what's breaking before employees actually complain about it.
Okay so first thing - definitely split out voluntary vs involuntary departures, that's huge. Monthly or quarterly breakdowns work best, and do it by department too. I'd also segment by tenure (under 1 year, 1-3 years, etc) because honestly the patterns there can be pretty telling. Don't forget your headcount numbers since 10% turnover hits way different when you're talking 20 people vs 200. Industry benchmarks are clutch for context - leadership needs something to compare against or they'll just stare at numbers. Oh and label everything super clearly with how you calculated stuff, trust me on this one.
The bar graph shows some pretty wild differences between departments. Sales is getting hammered with 20-25% turnover - those commission jobs are brutal. IT and Finance are way better at 8-12%, probably because they're not dealing with angry customers all day. Customer Service and Marketing land in the middle somewhere. Makes sense when you think about it - high-stress departments with lots of client drama lose people fast. Your back-office teams like Accounting stick around longer since it's more predictable work. Honestly, I'd throw your retention budget at Sales first since that's where you're bleeding the most talent.
Dude, engagement and turnover are totally connected. Disengaged people bolt way faster than engaged ones - it's pretty obvious when you think about it. If someone feels valued and sees room to grow, why would they leave? The numbers back this up too. High engagement teams always have lower turnover. Honestly, I've seen this play out at my last job - the departments where managers actually cared about their people had way less churn. So if your bar graph is showing turnover spikes, I'd definitely survey engagement levels first. Figure out where people feel disconnected from their work or the company's direction.
Check out Bureau of Labor Statistics or SHRM - they've got solid industry breakdowns by sector and company size. HR analytics companies publish this stuff annually too. Industry associations are goldmine for member data if you can get in. Just grabbed coffee with someone who swears by these reports. Pull your last 12 months of numbers first. Then compare against 2-3 sources, but make sure you're looking at similar company sizes and regions. Otherwise you're comparing your startup to Google, which doesn't help anyone. The role-specific data is really where it gets useful.
Honestly, start with your exit interviews - see what patterns pop up about why people are bailing. Three big things usually help: decent pay/benefits, clear paths for moving up, and not having terrible managers. That last one's huge btw - people quit bosses way more than jobs. Get your supervisors some actual leadership training so they don't suck at managing people. Also fix your onboarding because losing new hires in the first few months is just expensive. Regular check-ins help too, whether it's surveys or just grabbing coffee with people to see how they're doing.
Honestly, exit interviews are where you'll find the real tea about why people keep bailing. Sure, you can stare at turnover charts all day, but talking to folks on their way out? That's when you discover if it's actually your managers being terrible, crappy pay, or zero growth opportunities. Sometimes it's something totally random you never saw coming. The patterns become super obvious once you start connecting the dots - way better than just watching those depressing numbers tick up every quarter. At least then you can fix the actual problem instead of just... wondering why everyone hates working there.
Yeah, high turnover is brutal. You're constantly hiring and training while your current team gets burned out doing extra work. All that experience walks out the door too, which honestly might be the worst part. People start wondering if they should jump ship when they see everyone else leaving. The costs add up fast - recruiting, training, plus you lose productivity during transitions. I've seen the pattern before where turnover spikes and everything just falls apart productivity-wise. If your numbers look bad, definitely check those exit interviews. Figure out what's driving people away before it snowballs.
So basically you plot your turnover percentages on the y-axis and time periods on the x-axis. Pretty straightforward stuff. The cool thing is you'll spot patterns right away - maybe turnover always jumps in January or creeps up over a few quarters. Bar height differences make it super obvious when things improved or tanked. Oh, and you can stack bars by department if you want to see which teams are having issues. Way better than dumping a spreadsheet on your boss, trust me. I'd track it monthly so you catch problems before they get ugly.
Start with time-to-fill and retention rates by department - that's your foundation. Cost-per-hire matters too since turnover gets crazy expensive. Exit interviews reveal the real tea about why people leave. Engagement scores and internal promotion rates? Gold mines for predicting who's about to bounce before they actually do. Track new hire satisfaction at 30/60/90 days because those early quits mess up everything. Honestly, most companies just watch the numbers without connecting the dots. Put it all on one dashboard so you can see patterns and fix the actual problems instead of playing whack-a-mole with symptoms.
Check which departments are bleeding people first - that's where your real problems live. Timing tells you everything too. Six months? Your onboarding sucks. Two years? Career growth issues. I'd honestly start with your top three problem spots and build specific fixes for each. Compare your numbers to industry averages so you're not freaking out over normal stuff. Turnover data basically becomes your crystal ball for staffing - you'll see patterns before they wreck your team.
Yeah, turnover totally wrecks your budget. Each time someone quits, you're hit with recruiting fees, interview time, training costs - plus the new person's basically useless for months while they figure things out. We learned this the hard way at my last job. Replacing one person costs anywhere from half their salary to double it, depending on the role. Even dropping your turnover by just a few percent saves serious money on hiring. I'd definitely track both numbers together so you can show the boss exactly how much turnover's costing you.
Look, turnover assessments stop you from playing guessing games with your HR mess. Track the patterns and you'll actually see what's happening - people bailing after 6 months? Your onboarding's probably trash. One department bleeding employees? Bad manager alert. Here's the thing though - this stuff makes you proactive instead of constantly putting out fires. You can fix pay issues or dump toxic team situations before they explode. Honestly, most companies just ignore the data until it's too late. Check your numbers every quarter and actually do something about what you find.
Oh man, so many options! Excel or Google Sheets are your best bet to start - super easy for basic calculations and charts. BambooHR, Workday, and ADP all have built-in dashboards that'll do the math for you automatically, which is nice. Tableau and Power BI make everything look ridiculously professional if you want to get fancy with it. You could even use Monday.com or Asana if you're already in there for HR stuff anyway. Start simple with whatever you've got, then get fancier later when you need it. Trust me, don't overcomplicate it right off the bat.
-
Presentation Design is very nice, good work with the content as well.
-
Unique research projects to present in meeting.